GEX Map Guide: Understand Options Walls in Half an Hour
This guide teaches you to recognize the map—to find the Call Wall, Put Wall, and Gamma Flip in your options analytics platform or trading terminal. Chapters 2 and 3 explain why these walls exist and how to use them.
What a GEX Map Looks Like
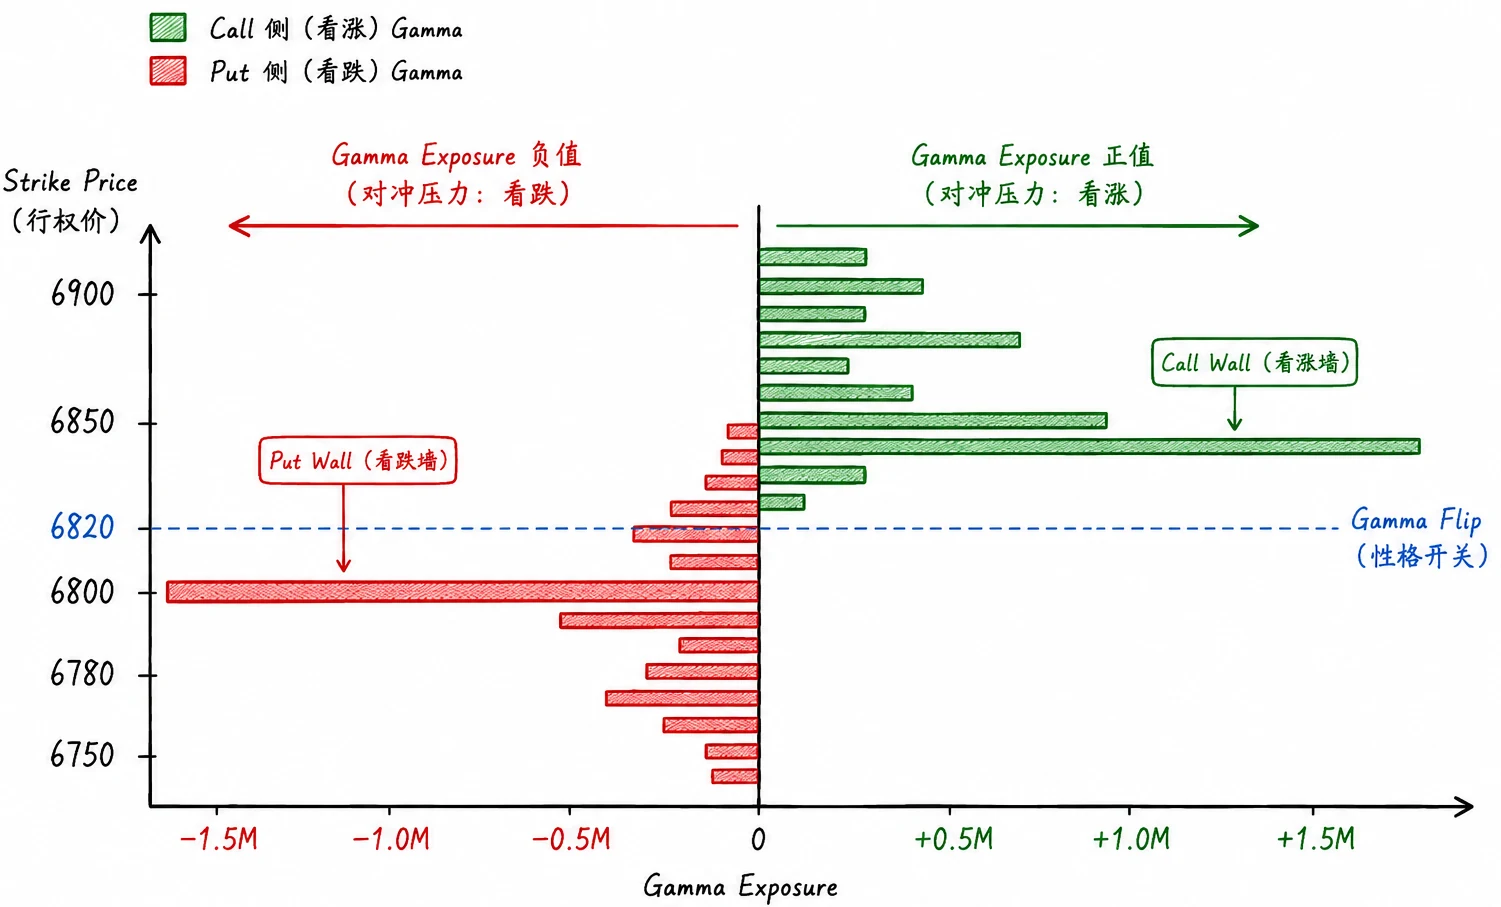
Guide Figure 1 shows the sort of chart you will usually see after opening the GEX (Gamma Exposure) view in an options analytics tool. Start by identifying four elements:
| Element | What to find on the chart |
|---|---|
| Horizontal axis | Strike price |
| Vertical axis | Bar height = relative hedging pressure at that strike |
| Green | Call side |
| Red | Put side |
Some platforms swap the x- and y-axes—strikes run vertically and the bars extend horizontally. Do not let the orientation distract you; the same elements are still there.
You do not need to calculate the bars. Learn to recognize the map first. You can read a weather radar without knowing how to build a meteorological model.
Every chart and mechanism diagram in this book is illustrative, not a trading signal.
Three Lines: Where to Mark Them
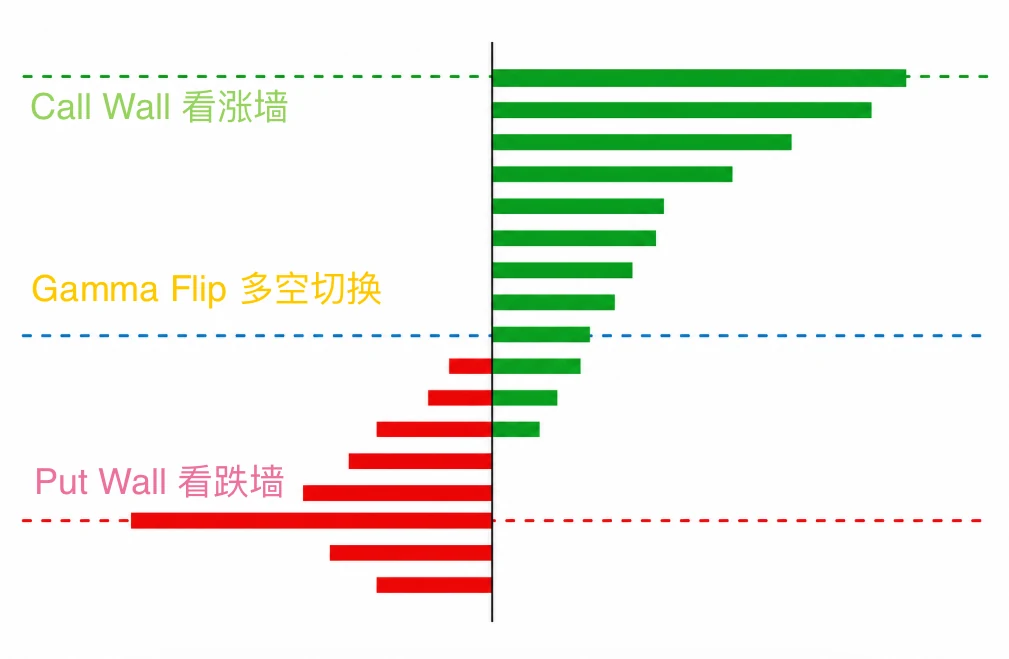
Guide Figure 2 reduces a screen full of bars to three lines: the Call Wall, Gamma Flip, and Put Wall. Use it to mark the same levels on your own platform.
The process has three steps. Mark the largest green bar as the Call Wall, the largest red bar as the Put Wall, and the boundary where GEX changes sign as the Gamma Flip. Some platforms label the last one Zero Γ or simply Flip.
If you can point to those three locations in your own software, you have accomplished the purpose of this guide. Chapters 2 and 3 explain what kind of market each represents and how to use them. If your platform also shows Net GEX ±, simply note whether it is positive or negative for now.
Do Not Confuse These Two Views
| When | What to use |
|---|---|
| Premarket | Usually an OI GEX snapshot → mark the three overnight levels |
| Intraday | Switch to Volume GEX → walls may differ from the premarket map |
| Final 30–15 minutes | Compare with OI again for the Pin phase; see the Appendix Intraday Rhythm Table |
❌ Common mistake: using the opening wall levels all day. Intraday walls move; follow the Volume view.
Where to Find Options Walls
An options-wall or GEX map is not tied to one product. Many tools now display SPX Gamma by strike: advanced brokerage data packages, specialist options-flow platforms, and market terminals with options modules among them. Look for these functions:
- A Gamma / GEX bar chart arranged by strike, often with green and red bars
- A switch between OI and Volume / real-time views
- Call Wall, Put Wall, and Gamma Flip levels—sometimes labeled Zero Γ, Flip, or Major Gamma
Different providers do not need to produce identical calculations or levels, and their labels vary widely. Focus on the function: use OI before the open to mark the structure, use Volume intraday to follow the active battleground, and compare OI again near the close to read the Pin. This book neither specifies nor endorses a provider. External statistics cited in the Appendix References are used only to calibrate probabilities; you do not need the same data source.
That is all for this guide. You do not need to memorize any mechanism yet. You only need to identify the three lines in Guide Figure 2 on your own platform: the largest green bar, the largest red bar, and the positive/negative boundary. If you get stuck, return to the Appendix Glossary.
I still remember opening a GEX chart for the first time: a screen full of red and green, with no clue which bar mattered. Eventually I realized that only a few features deserved attention; the rest was noise I could turn off. I wrote one sentence beside my monitor: OI before the open; Volume during the session.
In the next chapter, we return to June 4, 2026. The data unanimously said “do not short.” Why did so many traders still sell into it?
The answer was not in the chart. It was in the execution.