Chapter 3 · Reading Options Walls: Three Levels, Moving Walls, and the 0DTE Clock
Opening verseTo the Tune of Huan Xi Sha · Watching the Game
A century of wind and storm lies on one page;
who still recognizes the old rivers and hills?
A thousand points may rise or fall, and still the market rests at ease.
It does not lightly reveal its depths to ordinary eyes,
but writes its verse in the shifting walls.
Before the window, I bow to you and watch.
This chapter answers one question: how do you actually use the Call Wall, Put Wall, and Gamma Flip?
The guide taught you to identify the three lines. Chapter 2 explained why walls exist through market-maker hedging and positive or negative Gamma.
Now we begin with the map already marked and learn how to read it, combine the levels, and recognize failure.
First, something more important than identifying a wall: walls move. Once that is clear, the three levels make sense in the right order.
The Three Levels: A Quick Review
| Line | The question it answers |
|---|---|
| Call Wall | Where is overhead pressure concentrated? Be more cautious about chasing a long as price approaches |
| Put Wall | Where is support concentrated below? After a break, distinguish a false break and reclaim from genuine failure |
| Gamma Flip | What kind of market is this today—damped or accelerated? This has the highest priority |
OI vs Volume: use OI to mark broad structure before the open, Volume to follow the intraday battlefield, and compare both near the close for the Pin. See Chapter 2 and the Appendix Intraday Rhythm Table.
Three lines, three answers: where pressure sits, where support sits, and what mood the market is in.
Walls Move: The Wall You Are Watching May No Longer Be the Opening Wall
When I first discovered options walls, I misunderstood them.
I thought the Call Wall was resistance, the Put Wall was support, and the Gamma Flip was the dividing line. If those levels could be calculated before the open, surely the market would follow that map all day.
It often did not.
The Call Wall might be 6900 in the morning, yet price would cross 6900 with ease in the afternoon and continue to 6920 or 6940. For a while, I wondered whether the wall had failed.
Eventually I understood that the problem was not failure. The wall itself had been changing all along.
A wall is alive. The snapshot at the open is only the beginning of the day's story.
The Parking-Garage Metaphor
Chapter 2 compared each strike to one floor of a parking garage, with OI representing the cars that remain parked.
But that is last night's parking map. During the current session, cars are constantly arriving, leaving, and moving between floors.
The Call and Put Walls many traders see resemble the overnight map. Today's real battlefield appears in Volume GEX. Where the new cars park is where the new wall forms.
Walls Grow Thicker—and Thinner
Many traders watch only the wall's location and ignore its thickness. Thickness can matter even more than location.
A thickening wall says capital is accumulating there, increasing the probability that price will be attracted to or constrained by it.
A thinning wall says capital is leaving and the former support or pressure is weakening.
Do not watch only where the wall stands. A change in thickness can be just as dangerous.
Is This “Order Flow”?
Yes, but not the version most traders mean.
Traditional order flow tracks bids, offers, and transaction volume in the underlying or futures. Here, we are tracking order flow in the options layer. I call it Gamma order flow: new option trades alter market-maker hedging needs, and the resulting hedges feed back into price.
The loop is: options transactions → market-maker hedging → price. When price moves, it produces new options activity.
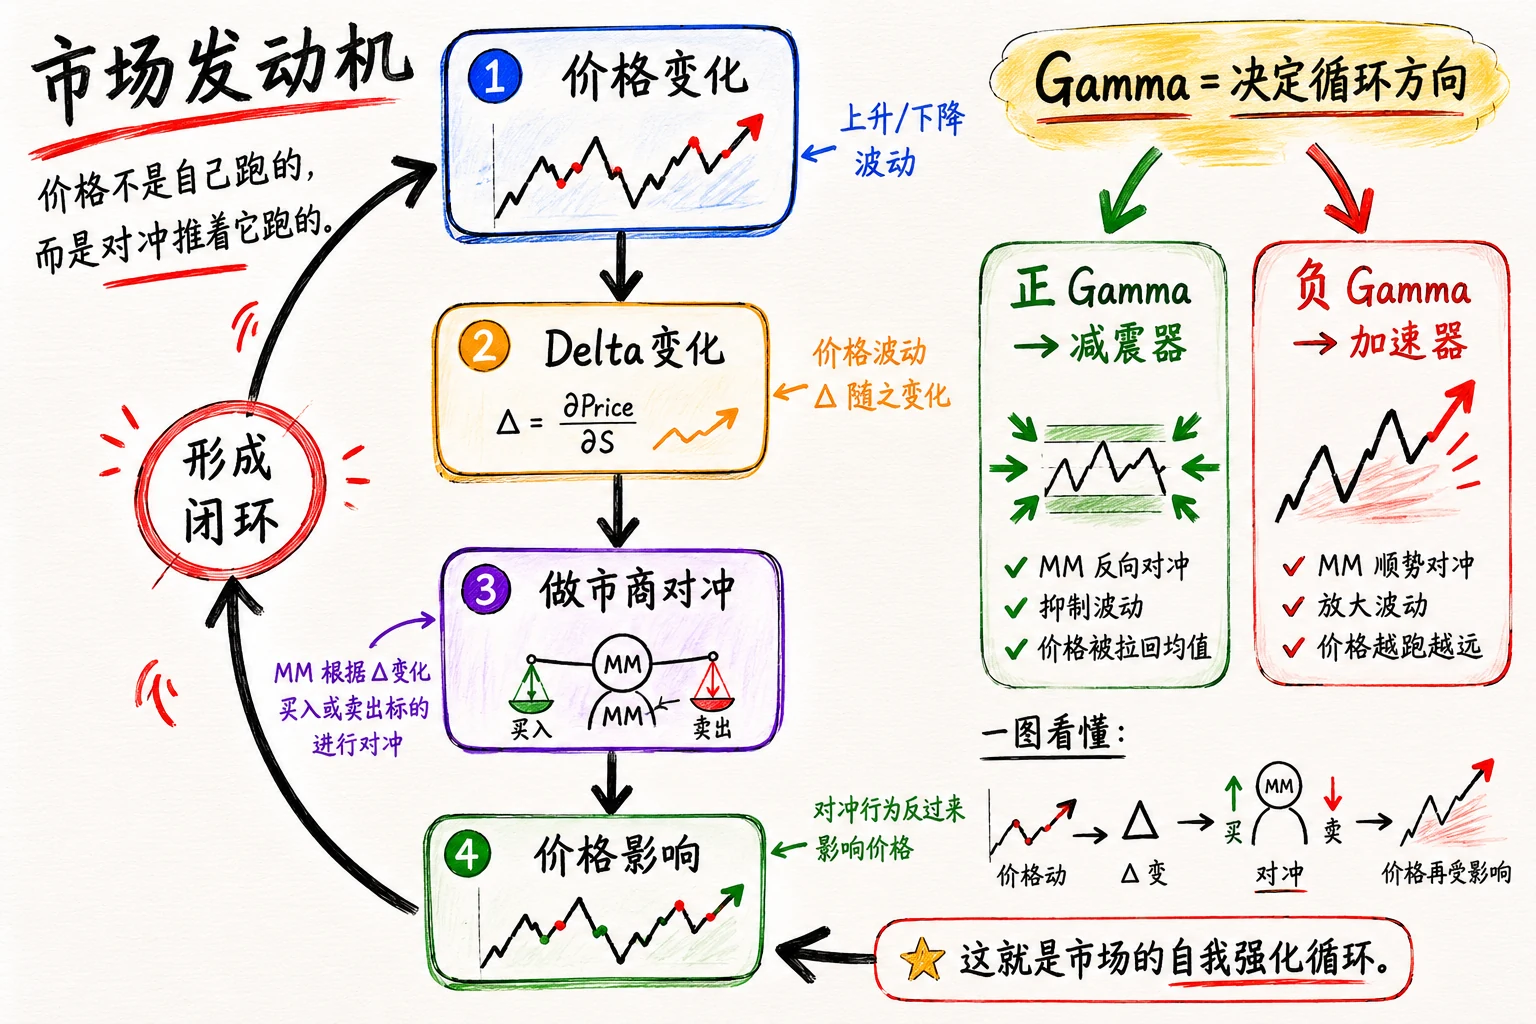
Dynamic Walls: What Is Happening Today
After the open, new orders appear continuously. Traders buy Calls, buy Puts, close positions, chase rallies, and buy dips. Every new trade quietly rewrites the day's Gamma distribution.
Platforms commonly display this change as Volume GEX, also called Real-Time GEX or Intraday GEX. The labels differ; the question is the same: at which levels is today's money concentrating?
That is a dynamic wall.
The static wall in the next section describes the original map. The dynamic wall shows where construction is happening now. Static alone shows yesterday; static plus dynamic shows today.
Often, the structure driving the current session is not the wall present at the open but the new wall growing in real time.
For intraday 0DTE, follow the wall moving now, not the snapshot frozen at the open.
Static Walls: Positions Left from Yesterday
The Call and Put Walls marked by many platforms are derived mainly from open interest (OI)—positions that remain open, often accumulated over days, weeks, or months.
An OI-based wall is like a building that already stood in the market. It tells you where large positions were already concentrated and where support or resistance was already more likely to develop. That is a static wall.
Static walls use OI; dynamic walls use Volume. Use the former before the open and follow the latter intraday.
Three Fates of a Wall
| Fate | What it looks like | How I read it |
|---|---|---|
| Move | The center of Volume shifts and the wall drifts slowly. It remains a wall at a new location | For a 5–10 point shift, first see whether Volume rebuilds at the new level |
| Break through | Price crosses on volume, consumes the old wall, and a new wall grows elsewhere. Structure remains recognizable | Require acceptance beyond the break, recognize the new wall, and stop defending the old one. Often seen when a Call Wall breaks upward |
| Collapse | The wall fails outright; price crosses it, no new wall catches the move, and the trend continues | Do not force a bounce script. Ask whether price can reclaim the level and where VWAP sits, as with the March 26 Put Wall |
The difference between a breakthrough and a collapse is whether a wall still exists. In a breakthrough, the old wall gives way and another forms elsewhere; the structure remains legible. In a collapse, the wall ceases to function and no replacement catches price—only the trend remains. For a buyer, an upward break through the Call Wall can be an opportunity. A collapsed Put Wall is the real danger.
There is another axis: does price reclaim the wall after breaking it?
- Positive-Gamma false break → a quick sweep, then reclaim, as on February 13
- Negative-Gamma genuine break → price breaks, does not return, and the wall collapses, as on March 26
A wall is not a promise. It is a probability.
Following Walls: Speed and Time of Day
Strike-level Volume GEX → fast; checking every 5–10 minutes is enough
Major Call / Put Walls  → slower; usually need 30+ minutes to move visibly
Gamma Flip              → relatively stable, but crossing it is itself an event
I refresh the Volume view when price comes within about 10 points of a wall, crosses the Gamma Flip, Volume erupts at a strike, or a macro release occurs.
If a wall moves 20–30 points or appears at an entirely new strike, I reassess the day's structure.
A moving Call Wall is not a disappearing wall. A panicked directional change often loses only to slippage.
When to Use Volume and OI
| Situation | Use |
|---|---|
| Premarket | OI GEX for broad structure |
| Intraday | Volume GEX for today's battlefield |
| Final 30–15 minutes | OI gains weight; compare it with Volume for the Pin |
Their importance migrates through the session; there is no fixed blend. See the Appendix Intraday Rhythm Table.
Read the map before the open and live traffic during the session.
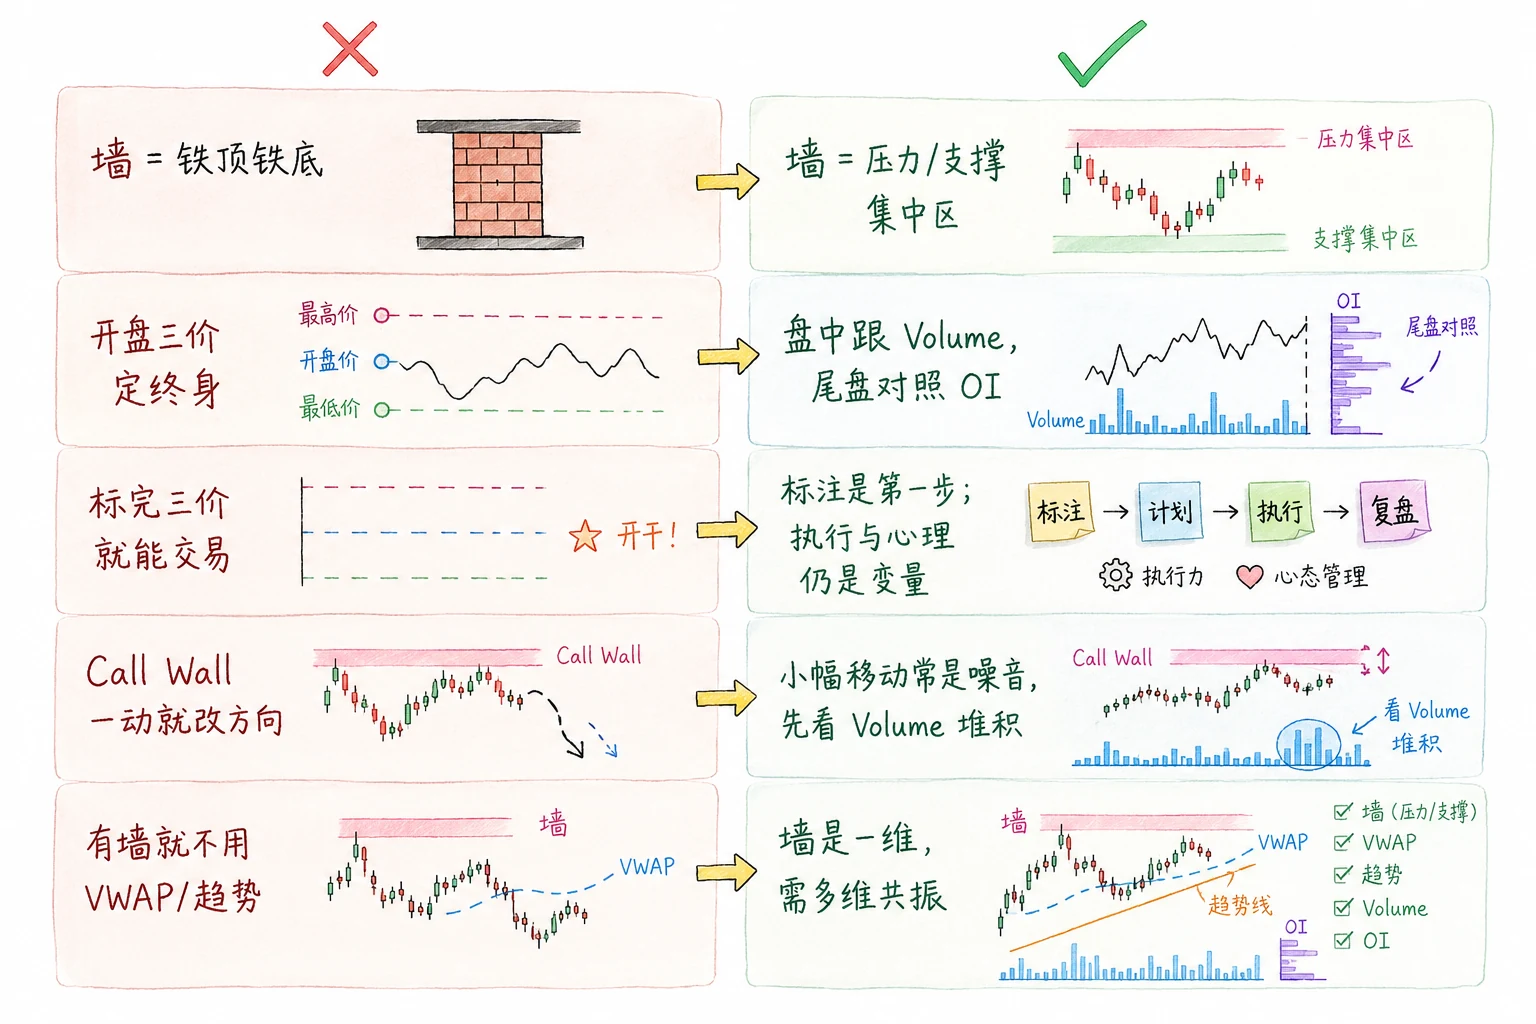
The hard part is never drawing the three lines. It is developing the right mindset toward them. It took me a long time to dismantle several assumptions. The figure above places five “before and after” shifts side by side.
At first, I treated walls as an iron ceiling and floor. I expected price to stop the instant it touched one. After being proven wrong several times, I accepted that a wall is never a guarantee. It is a zone where pressure or support is more concentrated. It offers probability, not a promise. Once you accept that, a broken wall no longer means “the market is wrong.”
I also thought the three levels marked at the open would govern the entire day, so I defended the morning map. But every minute of 0DTE changes the board. Follow intraday Volume, then compare OI again near the close. Maps expire; follow today's transactions.
Another illusion is that marking the lines means you are ready to trade. Marking is only the first step. Structure tells you whether the day justifies an idea. Execution and psychology determine whether you should act and whether you can hold the position. Three lines cannot answer those questions.
I used to reverse direction every time a wall shifted slightly, getting cut up by noise. Eventually I learned to pause. A three- or five-point drift is normal. First ask whether Volume is building at the new level; only then decide whether the view should change.
Finally, do not turn off everything else simply because you have walls. Walls are one dimension. They become more actionable when they agree with the cost basis—VWAP—and price action. Chapter 5 calls this three-way confluence GVP.
In the end, reading walls is less about lines than about whether you can accept that you do not know what happens next—and act only when probability leans to your side.
Two More Invisible Forces Beyond Gamma
The first two chapters focused on Gamma: wall thickness, the location of pressure, and whether today's market damps or accelerates movement.
Gamma describes force—how much market makers may be compelled to buy or sell, and whether volatility is likely to be suppressed or amplified.
But two other forces work in the background of a 0DTE session. They do not appear directly in the GEX bars, yet they often determine:
- where a deep V-shaped reversal comes from
- why an option loses value while the market moves sideways
- why the final minutes behave so strangely
No formulas are needed here. Build the picture.
Gamma is the gas pedal and brake. Vanna and Charm are the road surface and the clock.
Three Forces, Three Jobs
| Force | In one sentence | Metaphor |
|---|---|---|
| Gamma | Determines force—whether volatility is dampened or amplified | Shock absorber vs accelerator |
| Vanna | Determines where hedging flow pushes price after the temperature of fear changes | A falling thermometer and forced covering |
| Charm | Determines where hedging flow pushes price as time passes | A ticking clock and a changing inventory sheet |
Use Gamma to read walls, Vanna to read implied volatility, and Charm to read the clock. Together they form a fuller 0DTE map.
Vanna: The Invisible Foot When Panic Recedes
On February 27, SPX made a deep V-shaped reversal. Many traders asked, “Gamma was still negative. How could the market reverse?”
Part of the answer lies in Vanna.
What Is Vanna?
First, two terms:
- IV, or implied volatility—the market's current “fear temperature.” The greater the fear, the more expensive options become.
- Delta—how sensitive an option is to movement in the index.
Vanna connects them:
When the temperature of fear changes, an option's directional sensitivity changes. To avoid taking a directional bet, market makers must immediately rebalance futures hedges.
The metaphor, without formulas:
IV is the market's fear thermometer.
When the temperature surges, everyone rushes to buy Put insurance. After selling those options, market makers must first build futures hedges—like accumulating inventory.
When the thermometer falls rapidly and implied volatility collapses, excess hedges must be unwound quickly.
If the sell side of the book is already thin, that compelled buying can lift price mechanically, independent of fundamentals.
Vanna is the force that moves hedge orders when the thermometer changes.
The Full Chain Behind a Deep V
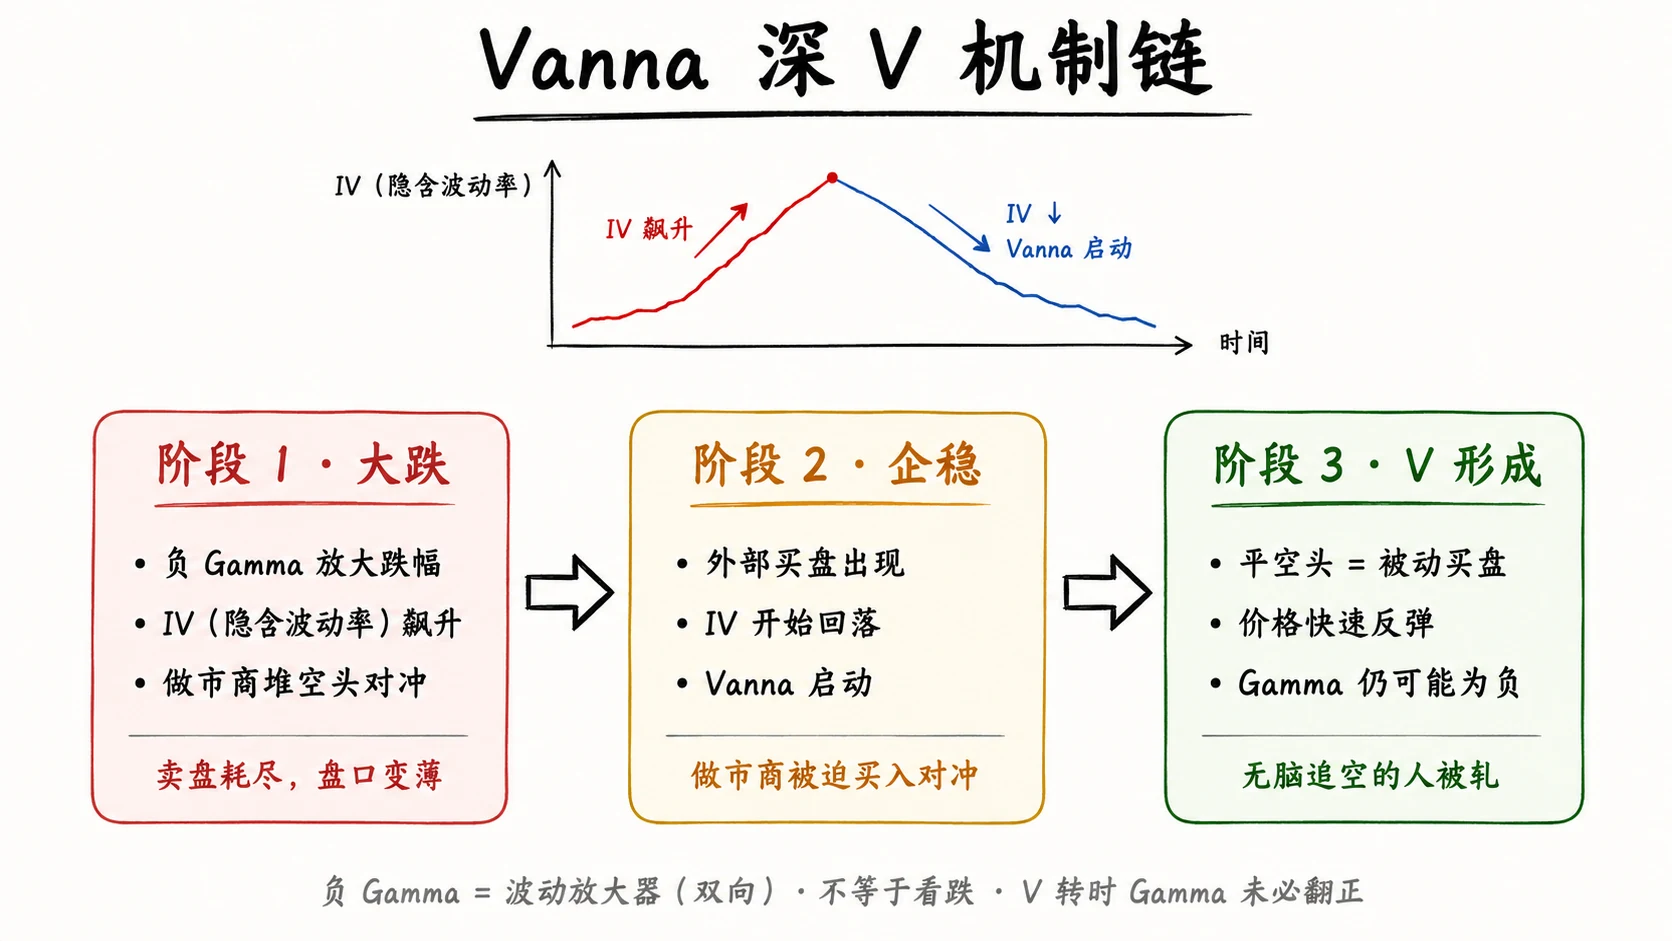
The figure breaks a deep V into three stages.
Stage 1: the selloff. Negative Gamma amplifies the decline, IV surges, successive waves of selling become exhausted, and the order book grows thinner.
Stage 2: stabilization. Meaningful external buying enters. Under negative Gamma, market makers must buy hedges as price rises. At nearly the same time, IV begins to fall; Vanna compels market makers to unwind previously accumulated short hedges, creating another wave of buying. The two flows combine and drive price upward rapidly.
Stage 3: the V forms. Price rebounds sharply, squeezing traders who assumed that “Gamma is still negative, so I can keep shorting.”
The key point: Gamma may still be negative when the reversal begins.
That answers the question, “How can a V form while Gamma is negative?” Treating negative Gamma as a reason to remain short is one of the easiest ways to be trapped by a deep V.
Vanna does not argue with you. It obeys the hedging obligation.
Three Dimensions for Evaluating a Possible V
In a negative-Gamma region, I do not watch Gamma's sign alone:
- Is the absolute magnitude of GEX shrinking? Negative Gamma moves back toward zero, easing hedging pressure
- Is price approaching the Gamma Flip? Stabilization and movement toward the Flip can precede structural change
- Is IV falling from an elevated level? A decline can activate Vanna-related hedging flow
Only confluence across all three makes me seriously consider a reversal.
Any one dimension by itself can become a trap.
Correcting Common Vanna Misreadings
| ❌ Misreading | ✅ Better interpretation |
|---|---|
| Negative Gamma means keep shorting | Negative Gamma amplifies volatility in both directions |
| A V means Gamma turned positive | Gamma may remain negative as the V begins |
| Vanna is too advanced to matter day to day | Vanna is often a major force in deep 0DTE reversals |
| Chase every V-shaped turn | A V requires multidimensional confirmation, not one signal |
| Falling IV matters only to option sellers | Falling IV → Vanna-related hedge adjustment → market-maker buying can lift price |
Vanna can become hidden buying triggered by a change in IV. During a deep V, it may be more violent than Gamma itself.
Charm: Price Stands Still While the Hedge Moves
SPX trades sideways near 6800 for ten minutes. The candle barely moves.
You think, “The market is flat, so my 0DTE Call should be fine.”
Not necessarily.
Charm is working in the background. Even when price does not move, time changes each option's Delta. Market makers must rebalance accordingly, and that adjustment can feed back into price—especially near the close.
What Is Charm?
The metaphor:
A market maker arranges futures inventory according to the current manifest—but the manifest rewrites itself as time passes.
The index can remain still while the clock keeps moving. The closer the market gets to the close, the faster that manifest can change, particularly in 0DTE.
When inventory no longer matches the new manifest, the warehouse must trade futures to rebalance. That process can brush against price.
The tape may look like lukewarm water while your 0DTE option keeps losing value. The market is not motionless; the hedge is moving.
Charm is time rewriting the manifest and compelling the market maker to change inventory.
Charm vs Theta:
| Theta | Charm | |
|---|---|---|
| What it changes | Option price | Option Delta |
| Effect on the buyer | Premium decays | Premium still decays while the Delta curve changes shape |
| Effect on the market maker | Indirect | Directly drives hedge rebalancing |
| In 0DTE | Severe | Equally severe |
Theta determines what the option is worth. Charm determines how sensitively it follows the underlying.
Why Charm Is So Powerful in 0DTE
In one sentence: Charm is severe in 0DTE not because time passes faster, but because so little time remains. Near expiration, Delta changes rapidly along the time axis. Market makers must continuously adjust their hedges. When this adjustment overlaps Gamma, Pin effects, and concentrated OI, the final minutes become exceptionally sensitive.
Reason 1: Gamma is very large. Near expiration, Delta becomes highly sensitive to strike and price. Even if SPX does not move, Delta slides along the time axis minute by minute.
Reason 2: hedges become stale. Market makers hold hedges based on current Delta. As Charm changes Delta, those hedges become outdated and futures must be traded to update them.
Reason 3: it overlaps with the Pin. Large OI at one strike near the close can keep price nearby. Charm continues to change Delta, forcing repeated hedge adjustments and potentially reinforcing the Pin.
Reason 4: the clock runs overnight. Time continues while the market is closed. Overnight Charm can leave some hedge imbalance to be corrected at the open. But keep the scale in perspective: opening volatility is usually driven mainly by order flow and news. Charm is one secondary clue, not an explanation for all opening disorder.
Reason 5: the final 30 minutes are most intense. Charm often reaches its strongest phase near the close. If price sits near a strike with high OI, a small move can trigger frequent hedge adjustments. I therefore treat the period after 15:30 as a separate risk regime.
The Charm Timeline
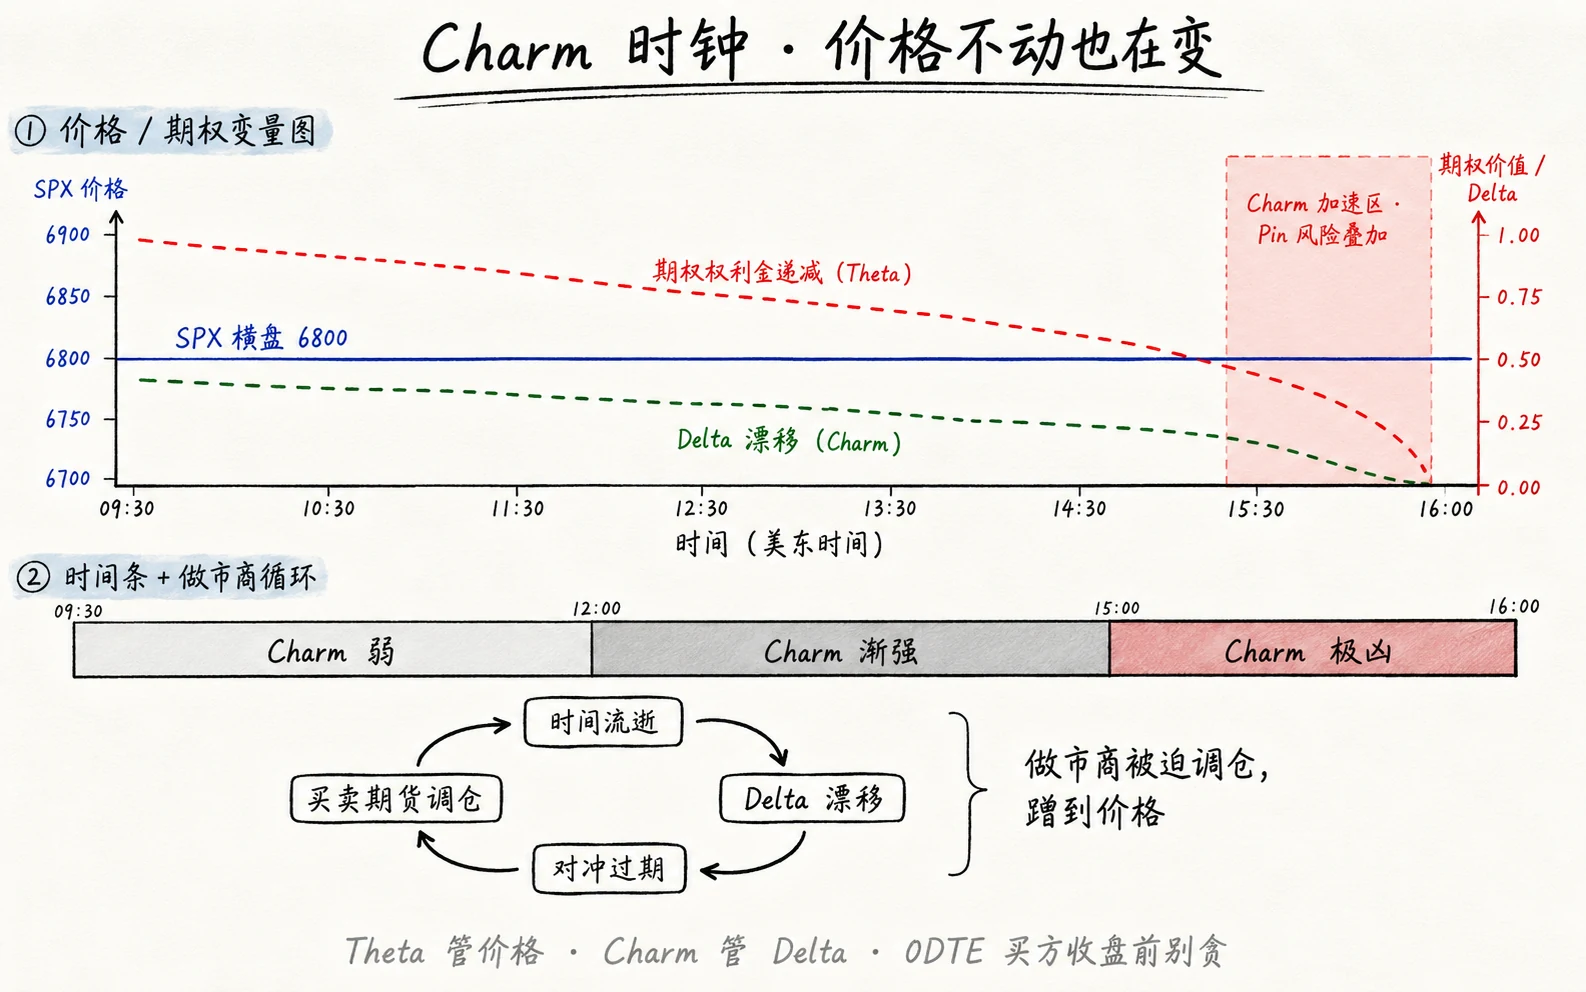
The Charm clock above shows how the force can intensify through the day. The table separates the stages:
| Eastern Time | What is happening |
|---|---|
| Overnight, market closed | Charm continues to change Delta; if hedges are incomplete, rebalancing demand may accumulate before the open |
| 09:30 open | Overnight hedge imbalance is corrected while opening flow reprices the market; structure is often unstable for the first 30 minutes |
| 12:00 midday | Charm gradually strengthens |
| 15:00 final hour | Gamma begins to dominate microstructure |
| 15:30 final 30 minutes | Charm accelerates; concentrated OI may strengthen the Pin |
| 15:45 final 15 minutes | I rarely open a new long-premium 0DTE position |
| 16:00 close | The day's 0DTE positions settle and most same-day Gamma exposure disappears; weekly and monthly OI remains |
The danger does not begin only at 16:00. After 15:30, the clock and the structure are often already moving quickly.
Do not use yesterday's wall to bet on today's open. Overnight changes reset the board, and walls begin again.
What Charm Means for an Option Buyer
- You can lose while price does not move: Theta consumes premium while Charm changes Delta
- Profit decays faster than intuition suggests: an extra 20 minutes exposes the position to Charm and Theta together
- Do not become greedy near the close: the Pin may pull price toward a strike regardless of your direction, while Charm makes Delta behavior hard to read in the final 15 minutes
Charm and Vanna: Different Jobs
| Charm | Vanna | |
|---|---|---|
| Driver | Time | IV—the temperature of fear |
| Typical setting | Sideways market near the close | Deep V after an IV collapse |
| In 0DTE | Present every day | Erupts when IV changes abruptly |
Correcting Common Charm Misreadings
| ❌ Misreading | ✅ Better interpretation |
|---|---|
| If price is still, the option is still | Charm + Theta continue to work |
| Charm is too advanced to matter | It cannot be ignored near the 0DTE close |
| Holding to the close earns a little more | The final 30 minutes contain Pin / Charm risk |
| Charm affects only sellers | It changes market-maker hedges, which affects everyone |
| Charm and Theta are the same | Theta changes value; Charm changes Delta |
Charm is time's invisible push on Delta. In 0DTE, even if SPX stands still, the clock and market-maker hedges are rewriting the value of your option.
Pin Risk: The Suction Effect Before the Close
At 15:55 Eastern, SPX keeps rubbing against 6800 and refuses to move away.
That may not be coincidence. It may be Pin Risk.
What Is a Pin?
A Pin is the tendency for the underlying to remain near a particular strike as expiration approaches. It is a recurring expiration-day phenomenon, not a precisely predictive indicator. Understanding how it forms is more useful than betting on its target.
It resembles an invisible magnet, especially:
- near the 0DTE close
- during monthly OPEX
- when OI is exceptionally heavy at a round-number strike
How Does a Pin Form?
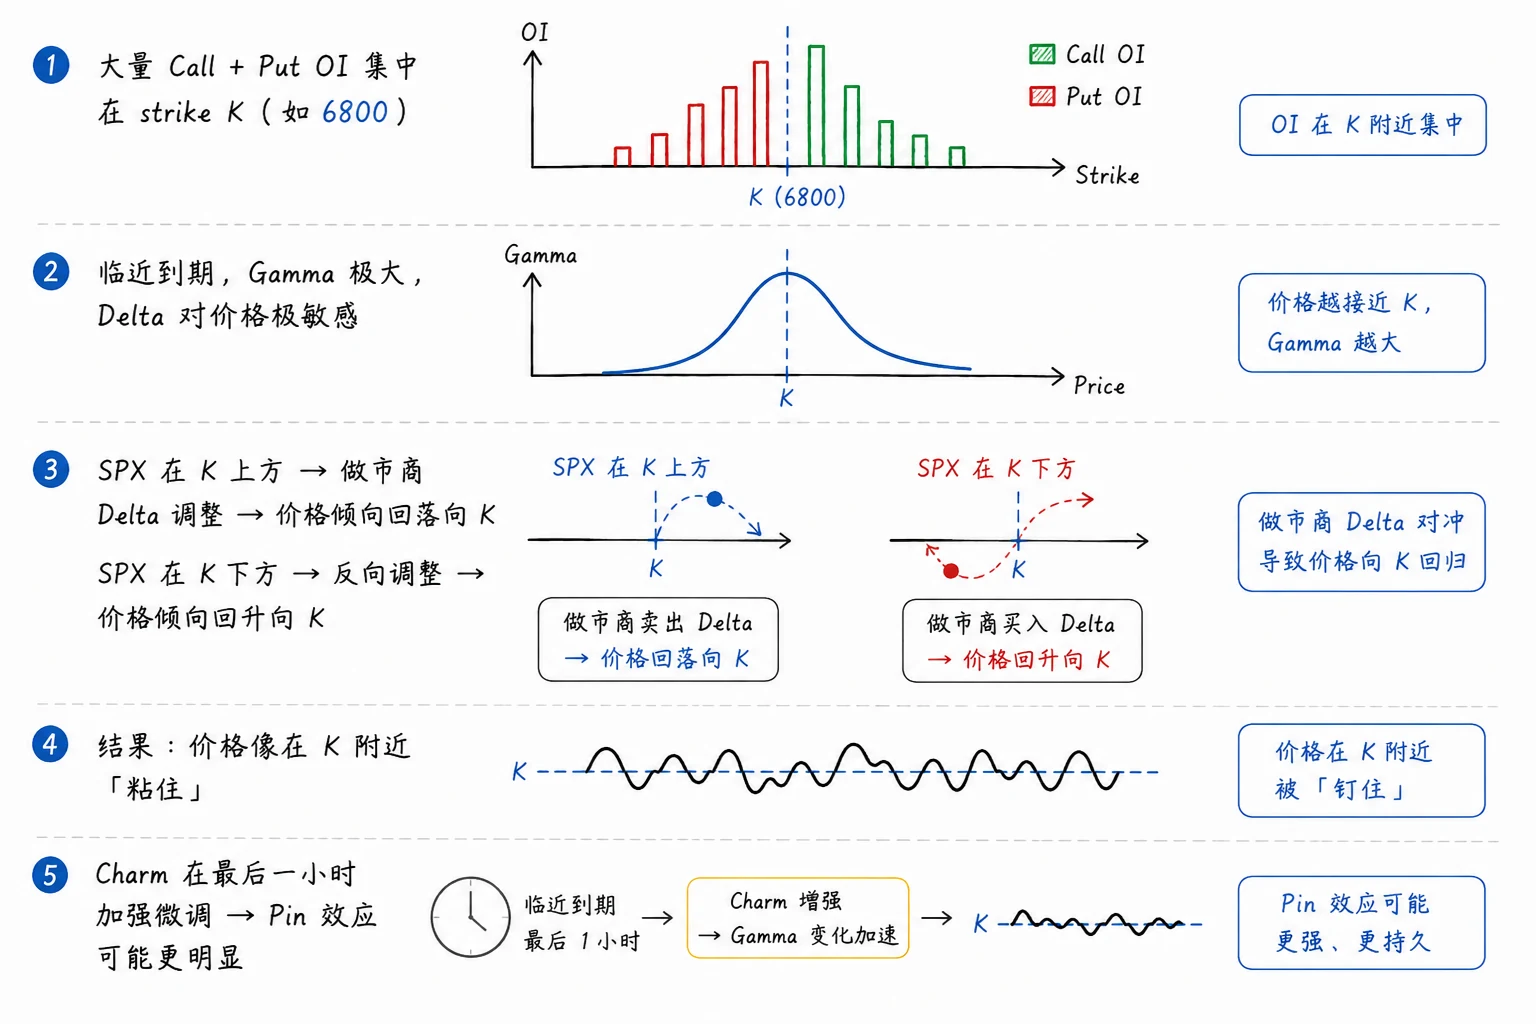
Figure 3-5 breaks the process into steps. Large Call and Put OI accumulates at strike K—6800, for example. As expiration approaches, Gamma on those contracts becomes extremely high and Delta becomes highly sensitive to price. If SPX moves above K, Delta-related hedge adjustments can pull it back toward K. If SPX falls below K, adjustments in the other direction can support it back toward K. Repeatedly, price behaves as though stuck near the strike. Add faster Charm-driven Delta adjustments in the final hour, and the Pin can become more visible.
There is no mystical force: only hedging geometry combined with large OI.
A Pin is not manipulation by a hidden hand. It is expiration geometry.
Max Pain and the Pin: Understand Them; Do Not Bet the Close
Traders often discuss Max Pain: the idea that price will settle at the level where the greatest number of options expire worthless. Many platforms publish a projected closing level every day. Frankly, it looks more like a retail indicator to me. I do not trust it or use it to make decisions.
Separate two ideas:
- As a phenomenon, a Pin sometimes appears near a strike with very heavy OI, with price lingering there before the close.
- As a signal, “price must close at this exact level” is unreliable. Macro events, strong trends, and especially a negative-Gamma environment can weaken or erase the Pin.
This book's position is clear: understand the Pin; do not bet on it. The final half hour already contains the day's greatest risk as Pin, Charm, and Theta overlap. Do not guess the closing price. If you need structure, full-session Call and Put Walls deserve far greater priority than a projected Max Pain level.
OPEX: A Stronger Version of Pin Risk
During monthly OPEX:
- monthly options and 0DTE overlap
- OI is often heavier
- Pin effects, Charm, and large-order flow can make the close more disorderly
During OPEX week, I usually:
- reduce position size
- rarely open a new long-premium 0DTE position after 15:30
- treat the Pin as risk, not opportunity
Pin Under Positive and Negative Gamma
| Environment | Pin tendency |
|---|---|
| Positive Gamma | Grinding ranges and oscillation near the Pin strike are common |
| Negative Gamma | A strong trend can break through and overpower the Pin |
A Pin does not appear every day. It failed when the wall collapsed on March 26 and when price struck the Call Wall on February 17.
Correcting Common Pin Misreadings
| ❌ Misreading | ✅ Better interpretation |
|---|---|
| Price must finish at a round number | A Pin is a tendency and macro forces often override it |
| A Pin proves manipulation | A Pin is the geometry of OI + hedging |
| Bet direction at the Pin strike | Volatility near a Pin can become distorted and risky |
| Ignore OPEX | Pin effects are often stronger during OPEX |
| Pin and Wall are unrelated | They often overlap, but walls matter all day; Pins are mainly a closing phenomenon |
How I Read the Final 30 Minutes
This is the same logic as Chapter 2's observation that OI gains weight in the final 30–15 minutes. The Pin is read from remaining OI, while full-session walls are read mainly from Volume. Compare them near the close.
- Find the strike with the largest OI. Does it agree with or diverge from the Volume GEX Wall?
- Is SPX repeatedly rubbing against that strike?
- For an existing position, should I exit or stay? I prefer not to add a new one
- Follow the Charm timeline: the closer to 16:00, the less willing I am to bet
Pin vs February 13 / February 17: Pin is the language of the close; Call and Put Walls are the language of the whole session. Do not collapse them into one term.
What I Want You to Take from This Chapter
- Walls move. Do not cling to one number from the open
- Walls have three fates: move, break through, and collapse
- Follow Volume GEX intraday; bring OI back near the close
- Gamma describes force—damping or acceleration; Vanna follows IV—mechanical covering after fear recedes; Charm follows time—Delta drift
- Vanna is an important force behind deep V-shaped reversals. Negative Gamma is not a standing invitation to short
- Charm explains why you can lose while price is still. Do not ignore it near the 0DTE close
- A Pin is a geometric result of concentrated OI. Understand it, but do not bet on it
- The final 30 minutes are a separate game. Pin, Charm, and Theta all act together
Notes from My Journal
Walls charged me some of my most expensive tuition:
Walls move. A Call Wall marked in the morning broke in the afternoon. At first I thought the wall had failed. Later I understood: the market was building a new one.
Walls also collapse. Sometimes I bought the Put Wall expecting a false break and reclaim, but price never returned. A wall is probability, not a promise.
Thickness can matter more than location. I paid for that lesson several times before it stayed with me.
I paid tuition for Vanna, Charm, and Pin as well:
I chased a short into a deep V and Vanna squeezed me. Negative Gamma is an amplifier, not a direction.
I lost money in a sideways market. Price barely moved while the option decayed. Charm was changing Delta in the background.
I bet on a round-number Pin before the close, and price did not stay pinned. A Pin is a tendency, not a promise.
This chapter covered how to use the three levels, why walls move, and how Vanna, Charm, and Pin work in the background.
That is enough theory. Now we return the framework to real sessions—to see how it works on a particular day and where it can fail.
The theory is ready. It is time for the trades.