Chapter 8 · The Liquidity Hunt: Psychological Wall Meets Options Wall
Opening verseTo the Tune of Bu Suan Zi · An Old Account
Night rain strikes the lonely window;
an old account opens to a new page.
Every stroke is marked with blood—
its price was far more than money.
I record these remaining fragments
without intending them for another.
If a fellow traveler reads at night,
we may watch the moon tilt together.
On January 23, 2026, SPX closed at 6915.61, reached an intraday low of 6895.50, and traveled only 0.54% from low to high.
Price action was as bland as lukewarm water. Underneath, the structure was dense: stop run, reversal from a GEX extreme, and a close drawn toward the Gamma Flip—three linked stages.
Why 6895 Instead of 6900?
The market tested the low three times and reached 6895.50. Not 6900, not 6898—6895.
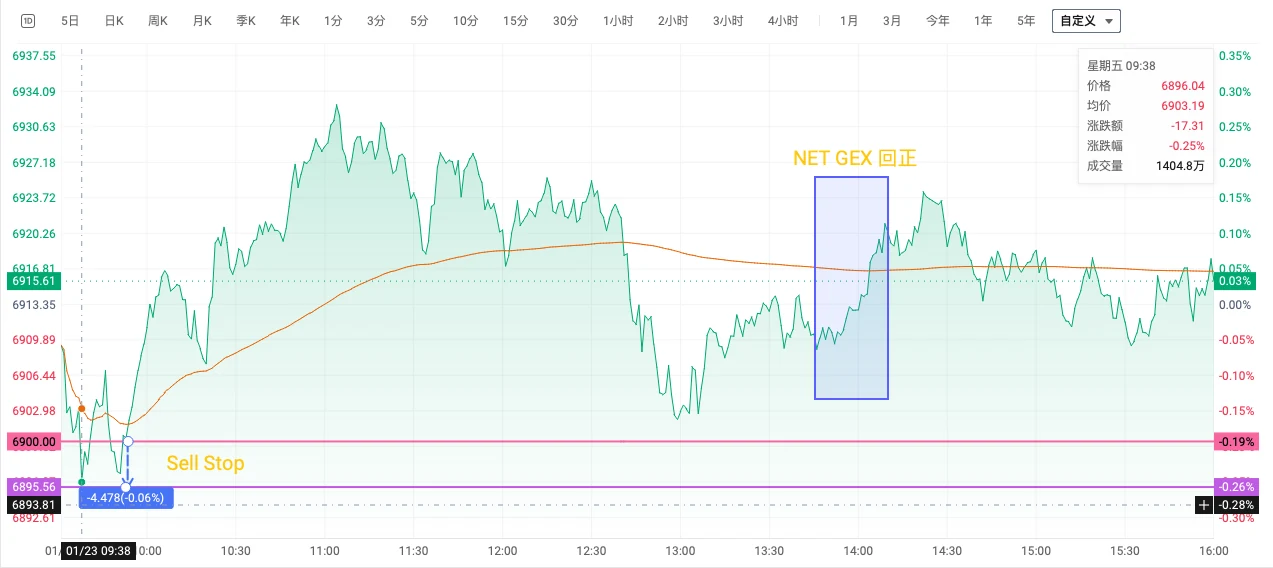
Figure 8-1 shows all three tests ending several points below 6900. None simply honored the round number.
The earlier version of me would think: 6900 is a major round number and therefore strong support. I would place a buy order at 6900, a stop at 6898 or 6899, and feel safe as long as the number held.
I eventually understood something else.
Large numbers of sell stops often sit just below 6900. Once triggered, they become market sell orders and supply liquidity. Institutional participants sometimes do not need to guess direction. They can push price through a round number, activate stops, and take the other side of fearful selling several points lower.
That is a stop run; see the glossary.
In hindsight—not as an intraday certainty—the three tests looked like this:
| Test | Low | My interpretation |
|---|---|---|
| First | 6895 | Test demand below |
| Second | 6898 | Invite hesitant traders to open shorts |
| Third | Break of 6900 | Clear stops below the round number |
Only after the last reflexive longs were removed did the market become lighter. Price rebounded and left swept stops behind.
The most important change in my process was to stop placing stops directly at round numbers. That sounds easy and is difficult.
“Round numbers are support” was not merely learned; it had grown into my way of seeing charts. Removing it required more than moving a stop. It meant fighting years of habit.
After January 23, I stopped placing the order at 6900 and watched structure below 6890 instead. The first weeks felt deeply uncomfortable. I kept thinking, “What if price really does bounce at 6900?” Eventually I accepted that missing one possible rebound is much easier than being stopped at the low and watching price return without me.
The actual sweep often sits five to ten points below the number. January 23 reached 6895; February 13 reached 6795. The mechanism was similar.
A round number is a psychological level, not necessarily a structural one. The liquidity hunt targets your stop, not your directional opinion.
The 13:45 GEX Extreme: What I Watch When the Data Looks Worst
The day's classic moment appeared around 13:45.
Volume GEX reached approximately −1000B, an extreme negative-Gamma reading. On the surface, this was the most frightening condition: market makers were extremely short Gamma and volatility should theoretically accelerate downward.
But price did not continue falling sharply.
In hindsight, an intraday negative-Gamma extreme can mean the short-side hedging trade has become deeply crowded. Much of the required selling may already have occurred. If price stops making new lows, I become alert: this may be seller exhaustion, not the beginning of another collapse.
Between 13:45 and 13:55, Volume GEX converged from roughly −1000B toward −500B. Hedging pressure eased, shorts covered, and price rebounded.
An extreme does not guarantee a reversal. March 26 showed that an extreme can become more extreme. But on January 23, extreme GEX + price refusing to follow lower was a combination worth noticing.
GEX extremes are an emotional thermometer, not a directional command.
An extreme says the trade is crowded. Crowding can intensify. Price must stop following before the message becomes actionable.
Gamma Flip 6915: Why Did Price Close There?
That afternoon, the Gamma Flip hovered near 6915–6916.
The close was 6915.61.
After clearing liquidity at 6895, price climbed gradually and stopped near 6915. Why there?
Avoid mystical talk of “structural gravity” and return to the Pin from Chapter 3. Near the close, when large OI concentrates at a strike, Gamma becomes extremely high. Market-maker hedge adjustments can pull price back toward the strike from either side, creating magnet-like behavior.
That day, the heaviest OI sat around 6915, extending toward 6920. The most important strike also overlapped the Gamma Flip, the boundary between positive and negative GEX.
Two forces pointed toward the same region: Pin geometry, where heavy OI attracted price near expiration, and Gamma Flip structure, where a return to the sign-change boundary suppressed volatility.
- Holding above the Flip → positive-Gamma region → lower volatility and greater pinning
- Falling below the Flip → negative-Gamma region → amplified volatility
During the final segment, the market shifted from negative-Gamma agitation back into positive-Gamma stability. That is why a 0DTE Put held through the last hour could lose time value and volatility premium extremely quickly. The candles were not lying; the market's character had changed.
The 6915 close was neither pure coincidence nor proof of manipulation. The heaviest OI and the Gamma Flip overlapped, quietly shifting probability toward the same region. I could not predict the exact closing cent, but I knew the day's attraction sat near 6915.
Three Battlefields on One Chart
Figure 8-1 can be divided vertically into three zones: the 6895 meat grinder, negative-Gamma disorder between 6900 and 6915, and positive-Gamma stability above 6915. The psychological level was 6900; the sweep occurred at 6895.
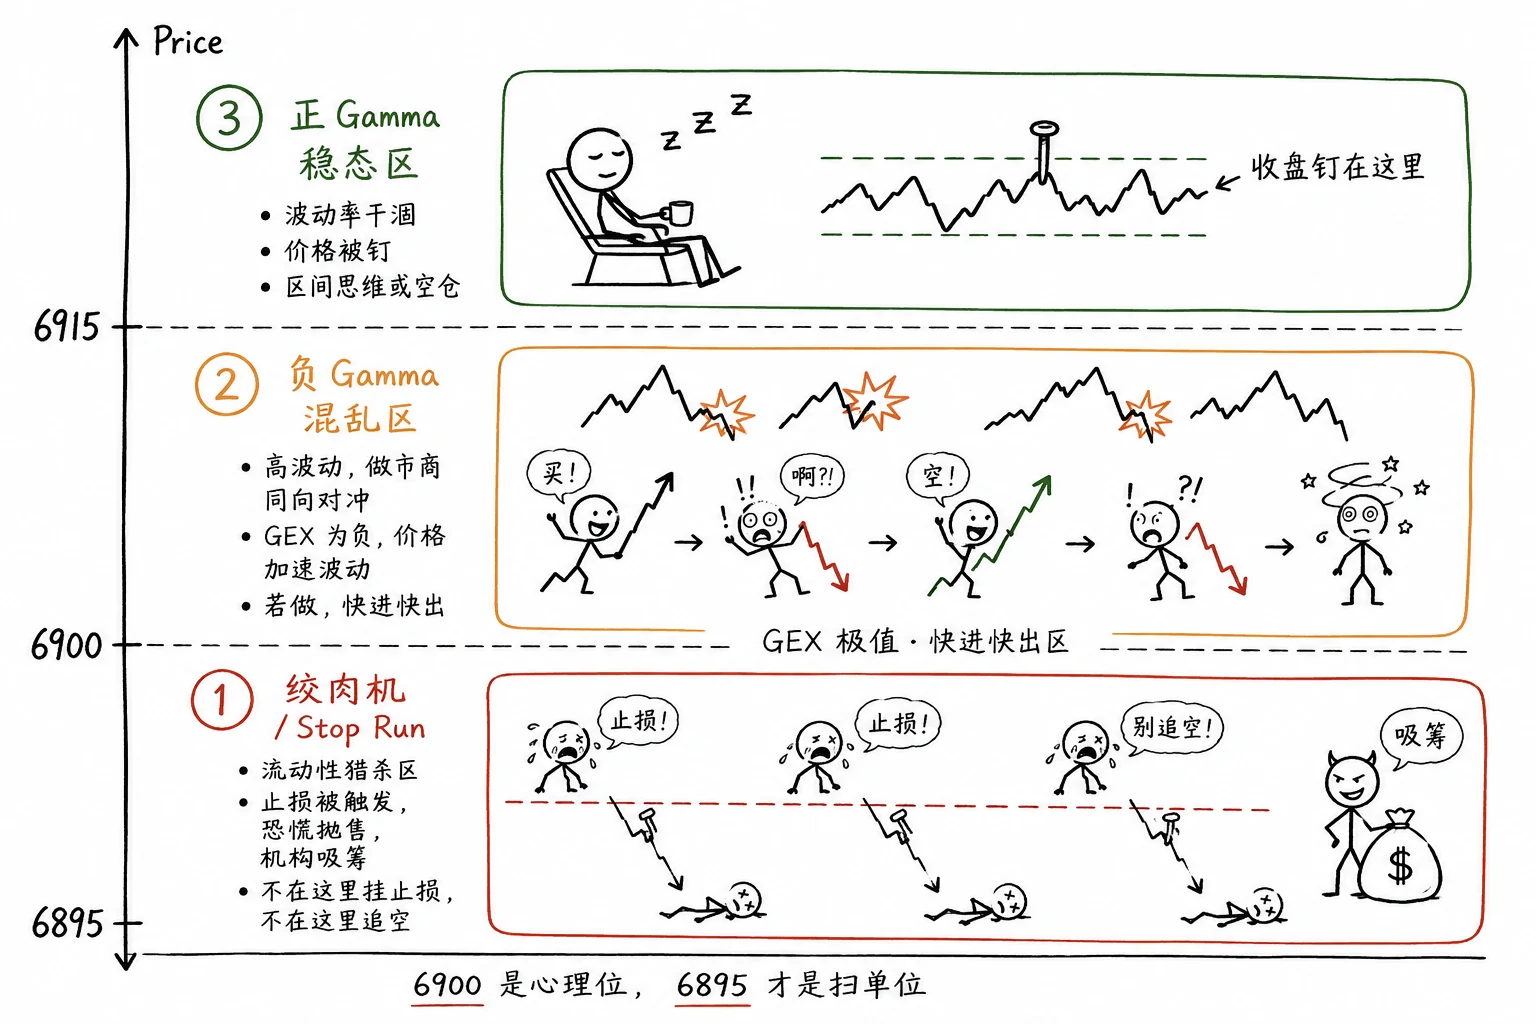
6895–6900: the meat grinder
- Liquidity-hunt zone
- Stops trigger, panic selling appears, and larger buyers absorb
- Do not place the stop here and do not chase a short here
6900–6915: negative-Gamma disorder
- High volatility and pro-cyclical market-maker hedging
- Negative GEX amplifies movement
- If trading, enter and exit quickly. The profitable move that day occurred in this zone
Above 6915: positive-Gamma stability
- Volatility dries up and price becomes pinned
- Small rises, small pullbacks, and a slow grind
- Think range or cash. For a long-premium buyer like me, the game was largely over
First identify the battlefield. Only then choose how to fight.
It took years to believe that sentence.
I once asked only, “Up or down?” Then I filled the screen with evidence for my answer.
Now I first ask, “Which zone am I in?” A meat grinder, disorderly region, and stable region require different approaches. The same price carries different meaning in different battlefields.
You do not need to win everywhere. You need to recognize, “This is not my battlefield,” and stay away.
January 23 vs February 13: Two Liquidity Sweeps
Both days appear to follow “break → sweep stops → reclaim,” but the structural readings differ.
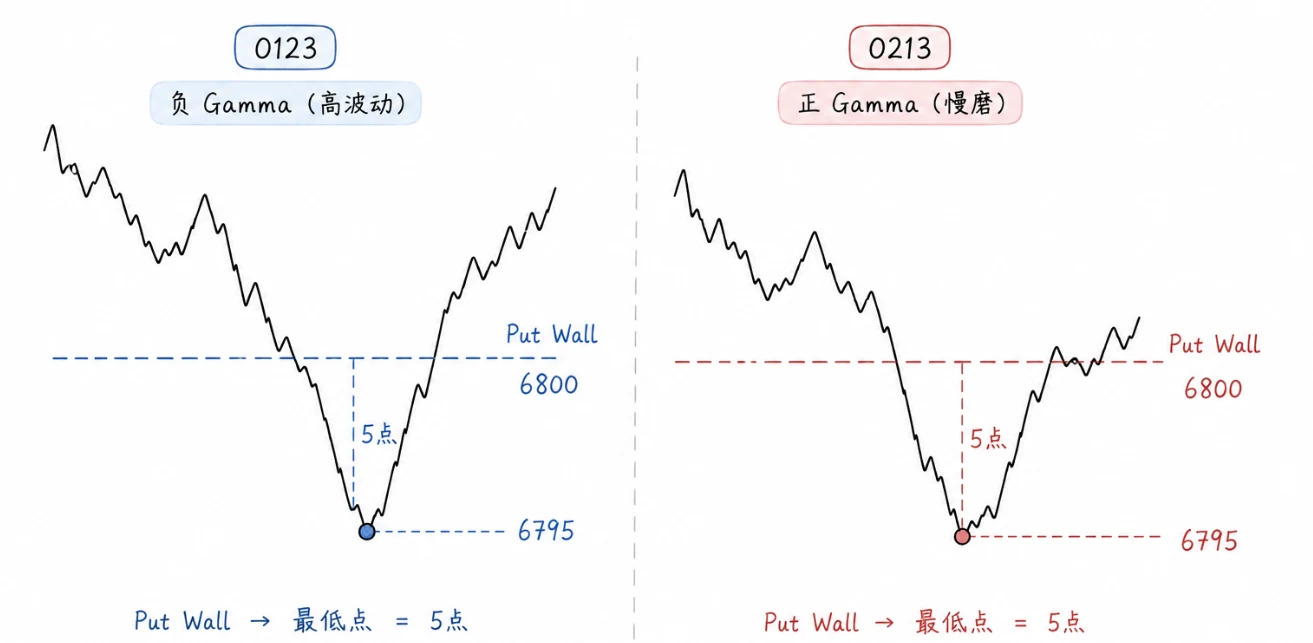
| January 23 | February 13 | |
|---|---|---|
| Sweep level | 6895, below round-number 6900 | 6795, below the 6800 Put Wall |
| Nature of key level | Psychological round number and stop cluster | Put Wall on the GEX map |
| Gamma regime | High-volatility negative Gamma | Slow positive-Gamma grind |
| GEX clue | Volume extreme near −1000B + price stops following lower | No comparable extreme; reclaim provided confirmation |
| Exit logic | Attraction toward Gamma Flip 6915 | Leave before Call Wall 6900 |
| Shared lesson | Break does not equal direction; the reclaim matters | Same |
January 23 left me with round numbers + stop runs. February 13 left me with structural walls + positive-Gamma patience.
The shape was similar; the battlefield had a different character. It cannot be copied and pasted.
The same pattern can produce an entirely different outcome in a different Gamma regime.
January 23 did not teach that tomorrow must sweep the same level. It taught: identify the battlefield before discussing direction. Below a round number, beside an extreme, and near the Flip, different rules apply. Forcing the February 13 wall-reclaim script onto 6895—or forcing the January 23 stop-run logic onto every Put Wall—confuses battlefields.
As these seven trading-day reviews close, I hope one habit remains: after a gain or loss, name where the trade failed or succeeded, rather than saying only that the market was strange. Structural language gives the experience a name. Turning that name into discipline is another task.
The first eight chapters mostly taught how to see the market. The next changes perspective: think like a market maker.