Chapter 2 · The Invisible Force Behind Intraday Price: Market Makers and GEX
Opening verseTo the Tune of Die Lian Hua · Reading the Map
Across ten thousand miles, markets rise and fall;
walls climb and sink, lines stand like mountains—
who can read the reason within?
Those who make the market follow their silent path
while the crowd rushes, fighting to be first.
One map, drawn in red and purple,
looks indifferent, yet holds a hidden design.
The market's changing weather can be measured;
watch with a steady eye as it rises and falls.
This chapter answers one question: on June 4, GEX, the Call Wall, and the Gamma Flip all argued against going short. Where did those lines come from?
The guide taught you to recognize three lines. This chapter explains how options walls are formed—how market-maker hedging builds GEX into one wall after another, and how positive and negative Gamma change the character of the market.
Chapter 3 covers how the three lines work together and when they fail.
There is a lot in this chapter, so here is a route map:
- Who market makers are, and why they must hedge
- From Gamma to GEX—how the bars are formed and calculated
- Positive vs negative Gamma—a shock absorber or an accelerator
- How three lines become options walls: Call Wall, Put Wall, and Gamma Flip
- What matters most in 0DTE: OI vs Volume, and five common traps
Before reading, remember these three statements. It is fine if you skip the formulas; understanding these is enough:
- A customer buys a Call → a market maker sells the Call → the market maker must buy futures to hedge → price receives upward pressure
- Positive GEX = market makers sell rallies and buy declines = the market behaves like a shock absorber
- Negative GEX = market makers buy rallies and sell declines = the market behaves like an accelerator
If you have not seen a GEX chart before, read the guide first. See the Appendix Metaphor Quick Reference for a comparison of the recurring metaphors.
Market Makers Are Not Your Counterparty in a Bet
The more trades I review, the more I think trading is less a contest against candlesticks than an encounter with liquidity.
Liquidity is the sense of ease in a market: when you want to buy, someone is ready to sell; when you want to sell, someone is ready to take the other side.
Many traders become impulsive in 0DTE because they do not understand the day's “weather.” The source of that weather is the market maker—an institution that continuously posts both bids and offers and stands ready to transact. When you buy, it sells to you. When you sell, it buys from you.
After you buy a Call, what is the market maker on the other side compelled to do? Once you understand that chain, the GEX map becomes much less mysterious.
Over time, I came to accept an explanation that does not sound much like value investing: news is often only the pretext for intraday movement; underneath, options-hedging volume is doing the pushing.
Earnings beat expectations, yet the stock drifts lower. The macro backdrop is quiet, yet the market suddenly rips higher in the afternoon. That does not necessarily mean someone is “manipulating” it. Often, market makers are adjusting positions mechanically to avoid taking a directional bet—what the industry calls remaining Delta-neutral. They are not betting on your story. They are balancing the book.
This self-reinforcing loop has a name: reflexivity. Price moves → hedges move → price moves again. GEX, Vanna, and Charm all describe parts of this chain, not the day's headlines.
You think the market is telling a story. In reality, it is running a program.
What Does a Market Maker Actually Do?
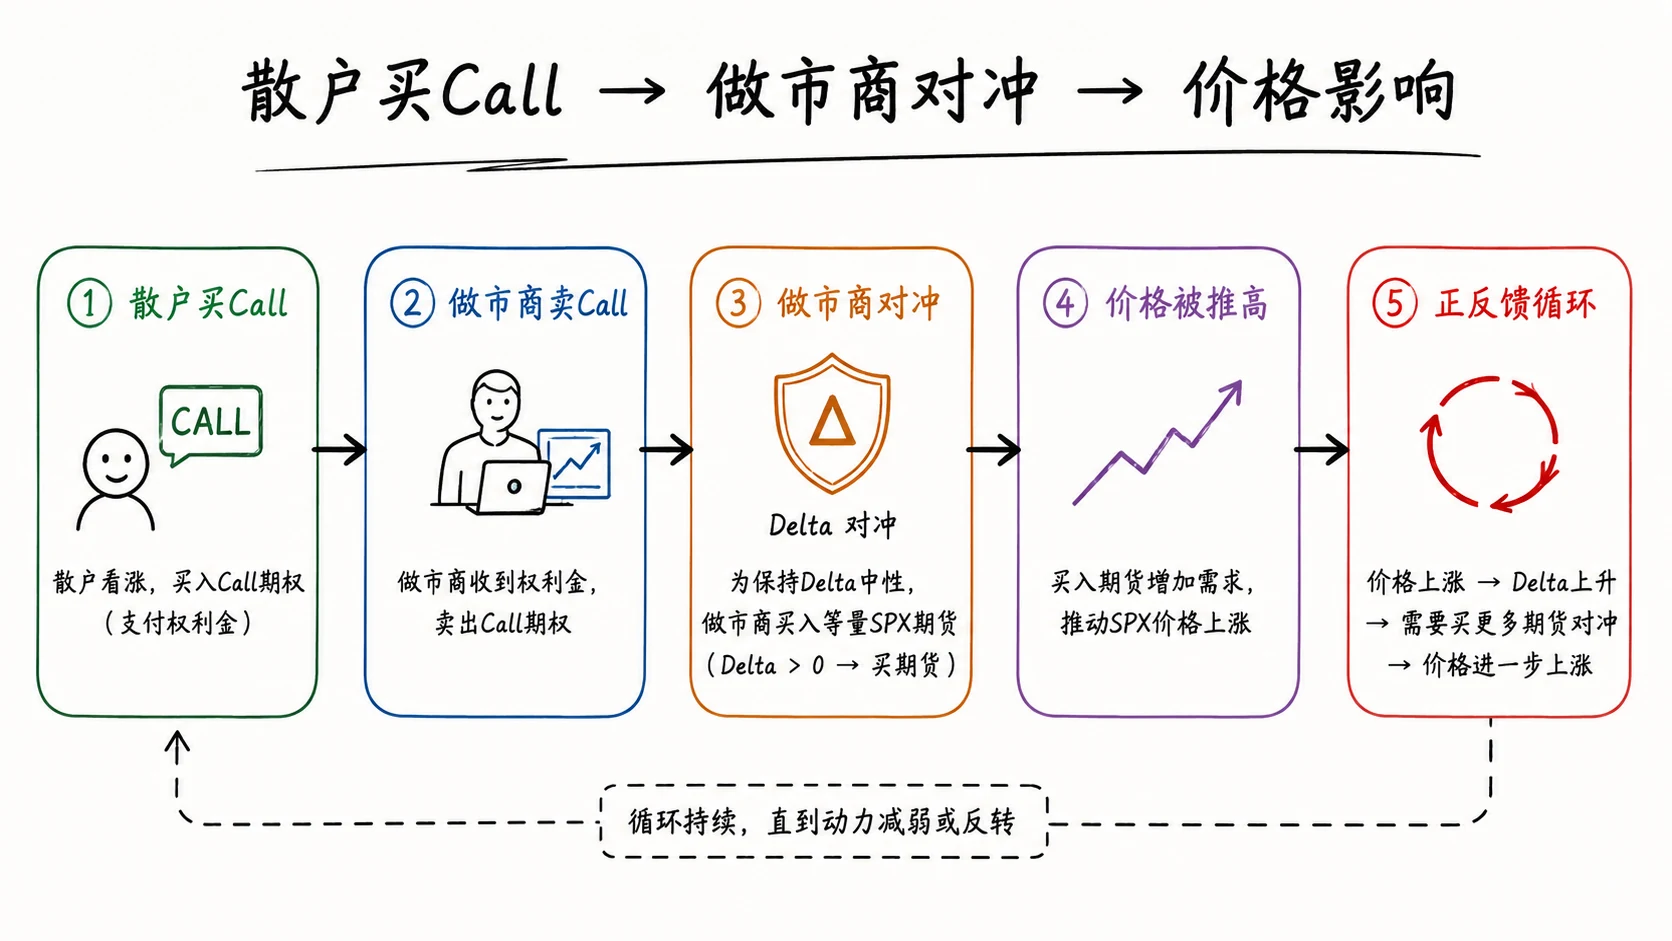
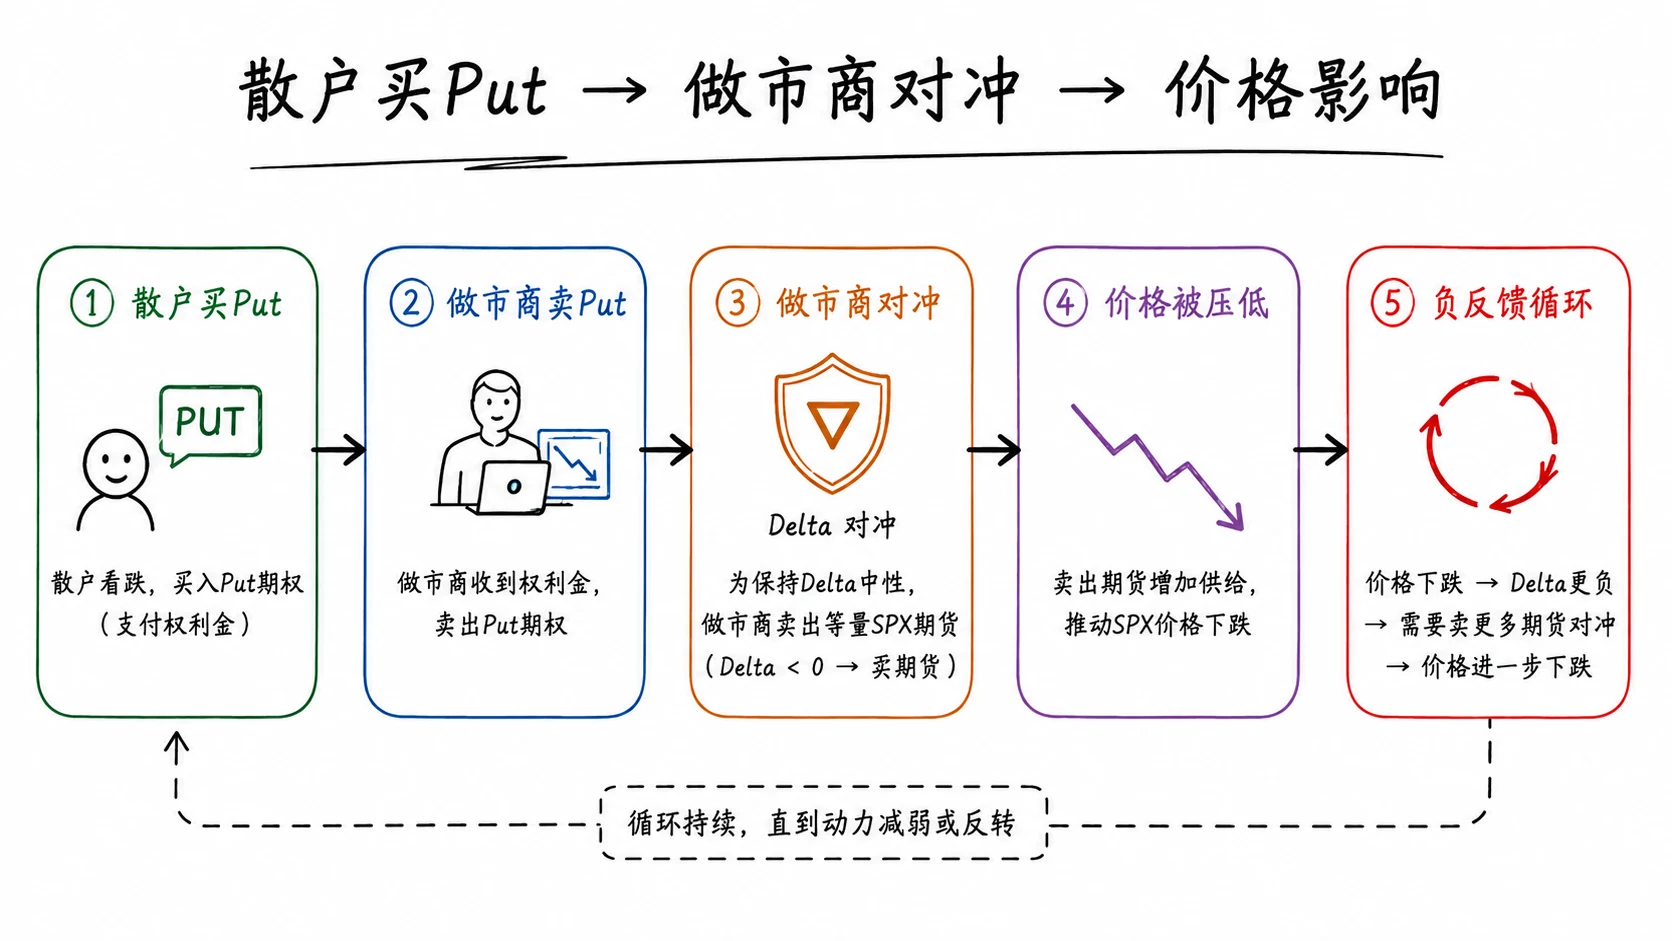
Figure 2-1a shows the Call chain: you buy a Call → the market maker sells it → the market maker must buy futures to hedge → that flow can push price higher. Figure 2-1b is the mirror image for a Put. The direction reverses; the logic is the same.
Rule 1: Their Job Is Not to Bet Against You
In the SPX options market, the cycle shown in Figure 2-1a runs roughly like this. You buy a Call and a market maker sells it to you. At that moment, the market maker owns a position that loses money as the index rises—a Short Call. The market maker does not want a directional bet, so it immediately hedges by buying something that moves with SPX, such as ES futures or SPY, to offset that risk.
The directional risk that changes as the index moves is called Delta exposure.
A market maker's role is to provide liquidity. It stands between buyers and sellers so you can transact when you choose. Its business is not “betting that you will lose,” but earning the bid-ask spread—the small difference between the price at which it buys and sells—and managing the hedge.
A market maker is not your opponent. It is the assembly-line worker that always receives your order and is always adjusting inventory.
Rule 2: Hedging Is Programmatic and Emotionless
The Put side in Figure 2-1b carries the same obligation in the opposite direction. Market-maker hedging is largely automated:
- A larger Short Call position → Delta becomes more negative, leaving the book vulnerable to a rise → the hedge requires buying futures
- A larger Short Put position → Delta becomes more positive, leaving the book vulnerable to a decline → the hedge requires selling futures
(Do not reverse them: Short Call → buy futures; Short Put → sell futures.)
Machines have no feelings—only hedging obligations.
In plain language, a market maker is an automatically balancing scale. When one side tips, it adds a weight—futures—to the other side until the scale is level again. There is no emotion, only a balanced book.
That is why GEX can help you read which way market makers may be forced to adjust their hedges. It reads transaction-driven pressure; it does not make a directional prediction.
Rule 3: GEX Is the Market's Weather Forecast
If trading is hunting, GEX is the day's wind direction:
- Positive GEX → market makers act as stabilizers → sell rallies and buy declines → volatility is dampened
- Negative GEX → market makers add fuel → buy rallies and sell declines → volatility is amplified
Two Regimes: Speed Bump vs Accelerator
First, a note on terminology. Later in the book, I alternate among “positive-Gamma environment,” “positive-GEX environment,” and “Net GEX > 0.” In practical market reading, I use all three to describe the same condition: market makers' net Gamma exposure is positive, and the market is in a shock-absorber regime. The negative side is the accelerator regime. Strictly speaking, Gamma is a Greek and GEX is an exposure calculated from it; they are not identical. For reading the market, however, do not get stuck on the labels.
The positive-Gamma speed bump
When GEX is positive:
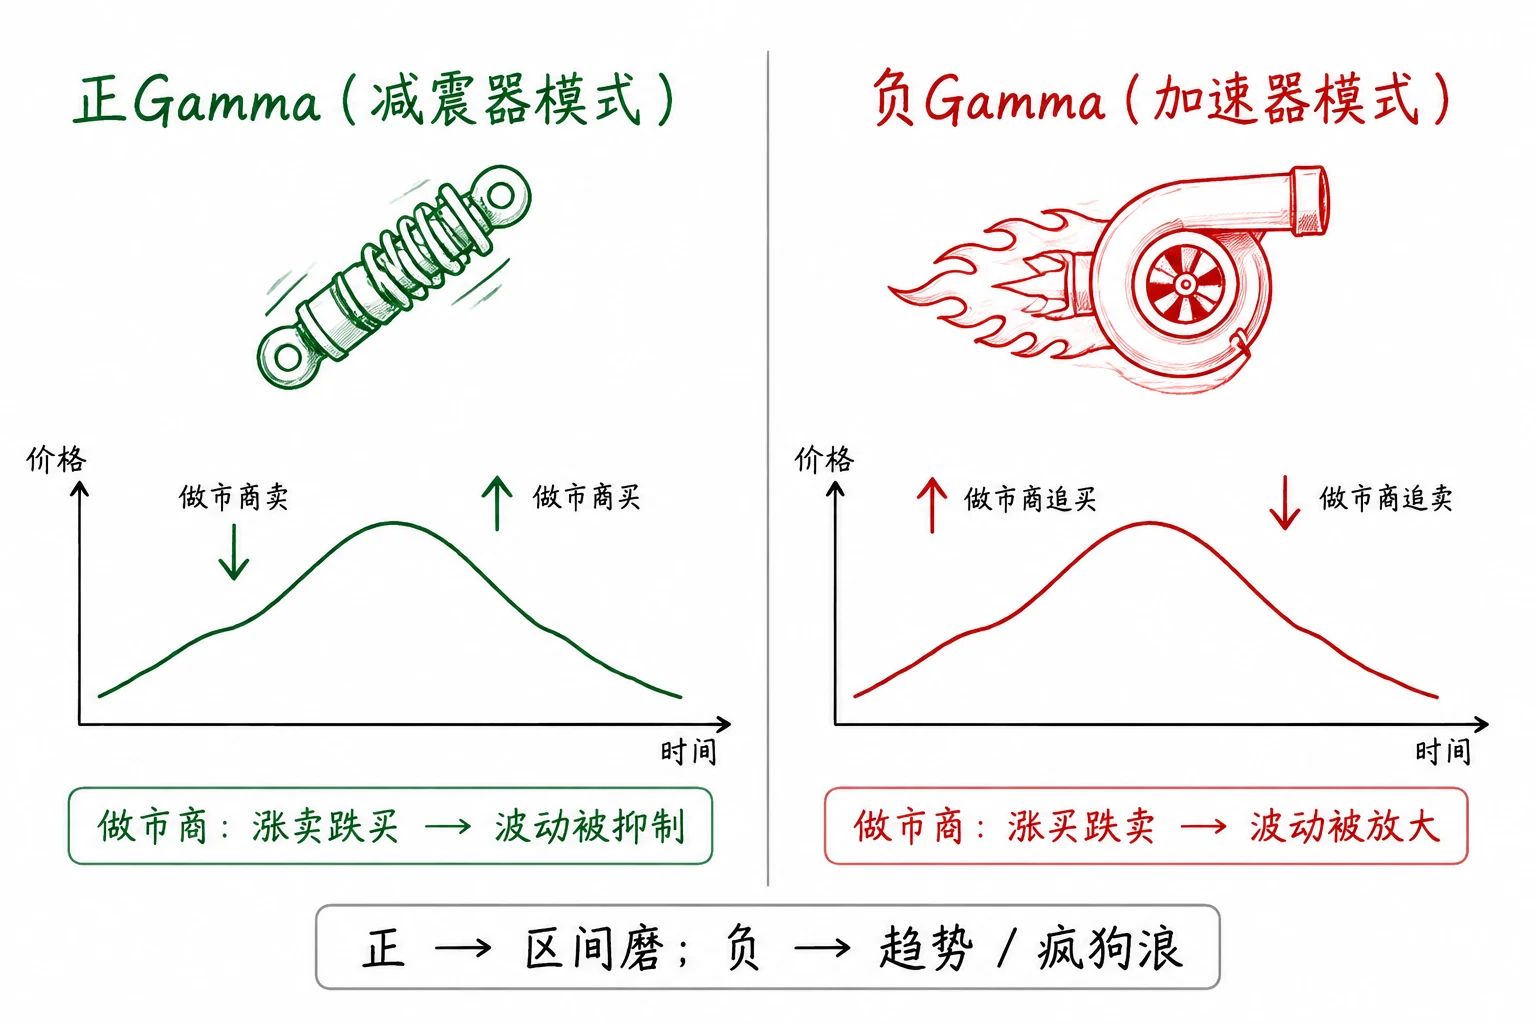
- Price rises → market makers must sell hedges → the selling restrains the rise
- Price falls → market makers must buy hedges → the buying supports the decline
Result: price tends to oscillate within a range and volatility tends to fall.
How I read it: a large one-way move is less likely. Price behaves as though attracted to a magnet.
The negative-Gamma accelerator
When GEX is negative:
- Price rises → market makers must buy hedges → the buying reinforces the rise
- Price falls → market makers must sell hedges → the selling accelerates the decline
Result: volatility expands and price can become disorderly.
How I read it: once a trend is established, it may travel faster and farther—but the direction must be confirmed by other dimensions.
The two regimes compared
| Positive Gamma | Negative Gamma | |
|---|---|---|
| Market-maker role | Stabilizer; counter-trend hedging | Amplifier; pro-cyclical hedging |
| As price rises | Sell futures and restrain the rise | Buy futures and reinforce the rise |
| As price falls | Buy futures and support the decline | Sell futures and accelerate the decline |
| Feel of liquidity | Absorptive; grinding range | Fragile; prone to cascading declines |
| Feel of volatility | Often suppressed; narrower range | Easily amplified; gaps and waterfalls |
This is not a bullish or bearish opinion. It is the same hedging obligation expressing two different personalities under different Net GEX conditions.
Positive Gamma is the speed bump; negative Gamma is the gas pedal. Know what kind of road you are on before deciding whether to accelerate.
Figure 2-2 condenses those two personalities into one diagram: the positive-Gamma speed bump and the negative-Gamma accelerator. Keep it in mind as we move into the GEX map itself.
Do Not Treat Market Makers as “the House”
Do not imagine market makers as a casino “house.” They are liquidity providers earning spreads and managing hedges. Their hedging is programmatic; it is not aimed at you personally.
The sign of GEX describes whether volatility is more likely to be dampened or amplified. It does not mean that market makers are bullish or bearish.
Your task is to read hedging flow, not to “defeat” the market maker.
You do not need to defeat the assembly-line worker. You only need to know where the inventory is moving next.
GEX: Magnets and Explosives Around Price
Many 0DTE traders begin with one question: “Will the market rise or fall today?”
GEX answers a different question:
Will price be pinned here, or will contact set it off? Will volatility be suppressed or amplified?
This section explains GEX from the inside out: what it is, why market makers must respond as they do, and how to read one map from morning to close.
You do not need to become a quantitative specialist. By the end, you should be able to look at a GEX distribution and say: Does today look more like a shock absorber or an accelerator, and at which strikes is hedging pressure concentrated? Those are the two regimes in Figure 2-2.
Chapter 3 covers how the three key levels combine and when they fail.
First, Form a Picture: What Question Does GEX Answer?
Before the open, I commonly see two approaches to reading the market.
Approach A—choose a direction first: bullish or bearish today, then wait for the candles to “confirm” it.
Approach B—identify the structure first: is today more like a shock absorber or an accelerator? At which strikes are the thick bars concentrated, and how does price usually behave near them?
GEX belongs to Approach B. It does not guess where the market will close. It reads compelled hedging flow—the buying or selling market makers may need to perform to rebalance Delta.
| Common question | The question GEX asks |
|---|---|
| Will the market rise or fall today? | Will volatility be suppressed or amplified? |
| Where is support or resistance? | At which strike is hedging pressure concentrated? |
| Can I chase a breakout? | Near a thick bar, will price grind back toward it or accelerate through it? |
Candles tell you what has already happened. GEX tells you that hedging orders still sit behind the move, pushing and pulling price in ways the candles alone cannot show.
Candles are the result. GEX is part of the cause.
Three Metaphors—Remember Any One of Them
Metaphor 1: shock absorber vs accelerator
- Positive GEX → market makers behave like a shock absorber: they sell when price rises and buy when it falls. Price is more likely to grind and revert near a wall.
- Negative GEX → the market has an accelerator: they buy when price rises and sell when it falls. Small moves can be amplified into sharp rallies or declines.
Metaphor 2: map vs weather
- OI GEX = the terrain map printed last night, showing where the mountains stand
- Volume GEX = today's live weather, showing which way the wind is blowing
A 0DTE buyer who carries only the terrain map and ignores today's wind is dressed for yesterday's forecast. The mismatch is costly.
Choose the metaphor that stays with you. You can forget the rest.
What Exactly Is GEX?
What does GEX quantify?
GEX—Gamma Exposure—measures how strongly options positioning can affect movements in the underlying through market-maker hedging.
The core chain is:
Customers buy options → market makers sell options → market makers must hedge Delta risk
→ those hedges affect the underlying → GEX quantifies that influence
GEX does not predict direction. It tells you whether volatility is more likely to be suppressed or amplified—and at which strikes the pressure is most concentrated.
GEX is not a crystal ball. It is an X-ray: it reveals the skeleton beneath the candles.
Principle 1: How Is One Contract Calculated?
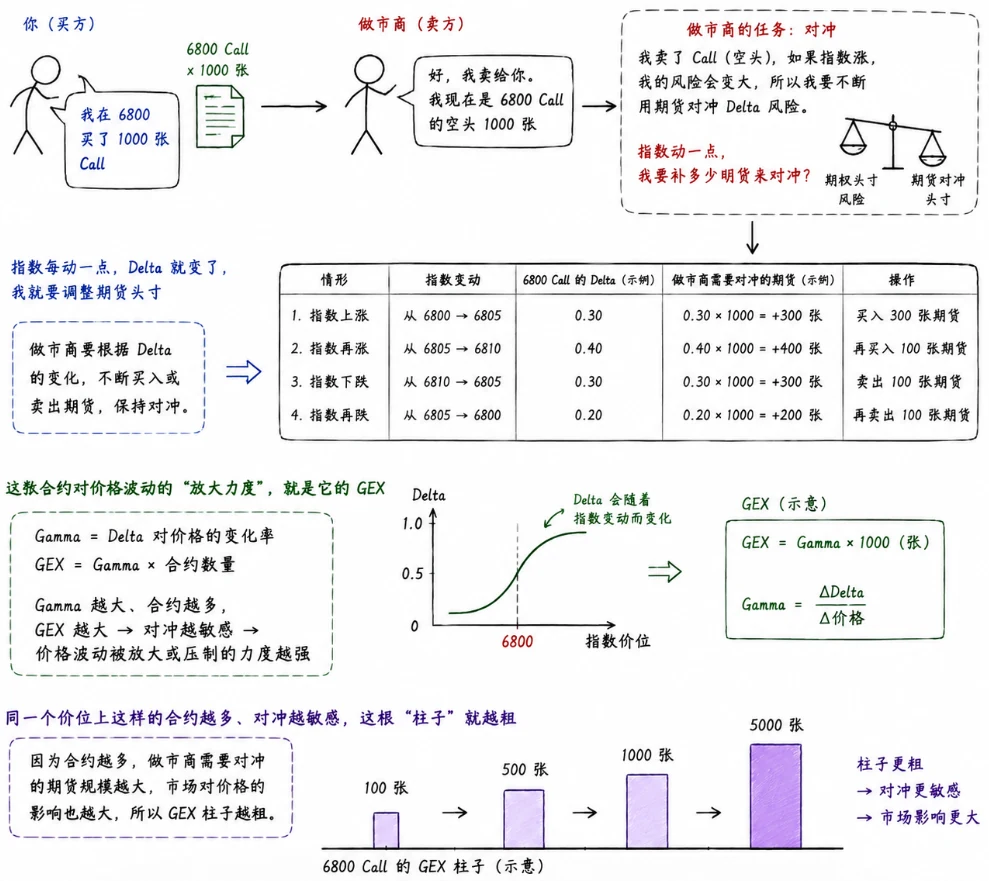
Start with a picture.
You buy one 6800 Call from a market maker. The market maker must now monitor that contract: if the index moves by one point, how many futures must be added or removed from the hedge?
The contract's capacity to amplify price-related hedging is its GEX.
The more such contracts exist at one level, and the more sensitive their hedges are, the thicker the bar becomes.
Written as formulas:
Raw GEX    = Gamma × Open Interest × 100
Dollar GEX = Gamma × Open Interest × 100 × Index Price S
Providers calculate Dollar GEX somewhat differently. Some multiply by price once more and normalize for a 1% move. For market reading, relative size matters more than the absolute number.
In practice, I pay more attention to Dollar GEX because it directly reflects the notional amount required for hedging. You rarely need to calculate it yourself. Most platforms calculate it and draw the bars for you. Remember only this: the taller the bar, the greater the hedging pressure.
| Symbol | Meaning |
|---|---|
| Gamma | The contract's sensitivity—how quickly the required hedge changes as the index moves |
| Open Interest / Volume | Use OI before the open; use the day's Volume intraday |
| 100 | The SPX option contract multiplier |
| S | Index price, included only in Dollar GEX |
In other words: roughly how much must market makers buy or sell to hedge when SPX moves one point? The larger the number, the heavier the structural pressure at that level.
Common chart convention:
| Type | Sign | Chart color |
|---|---|---|
| Call | Positive | Green |
| Put | Negative | Red |
Add the GEX of all Calls and Puts at a strike to obtain its net pressure bar—the green or red bar on the map.
Connect the thickest bars on each side and you have the “options walls” in this book's title. The largest concentration on the Call side is the Call Wall; the largest on the Put side is the Put Wall. Put simply, an options wall is the wall that market-maker hedging pressure builds around price. Every later reference to a “wall” means this structure.
You can skip the formula. Remember only: the taller the bar, the greater the hedging pressure.
Principle 2: Follow One Trade Through the Entire Chain
The figures below are illustrative only, not data from a particular session.
First, three terms:
- ATM (at the money): the strike sits near the current index price
- ES futures: futures that track SPX and are commonly used by market makers for hedging
- Delta ≈ 0.5: if the index rises one point, the option gains roughly half a point
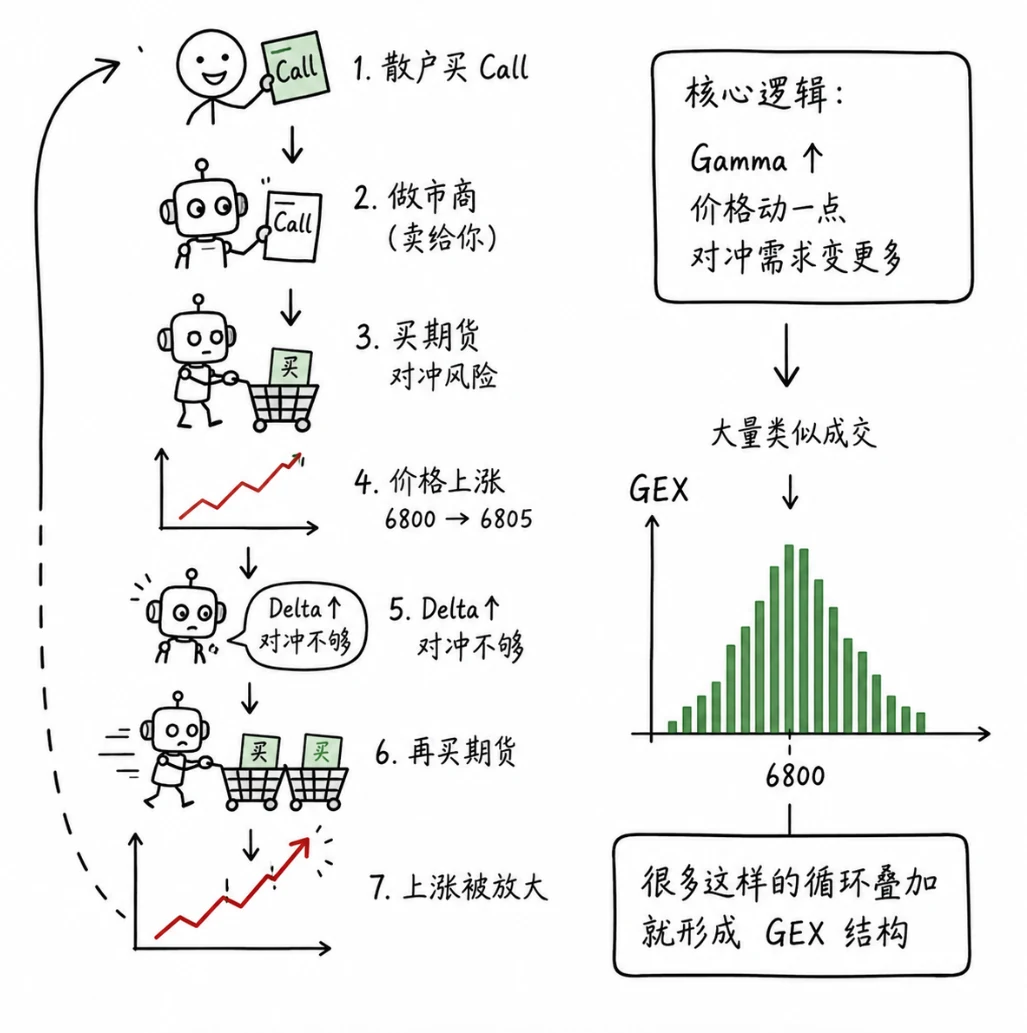
The point of this figure is not the formula. It is a feedback force in the market.
Begin with one Call. A trader buys it. For the trader, it is a directional position; for the market maker, it is risk that must be managed. By selling the Call, the market maker becomes exposed to losses if price rises. To avoid a directional bet, it buys the corresponding amount of futures or underlying as a hedge. That creates the first increment of buying flow.
The process does not end when price rises. If price moves from 6800 to 6805, the Call's Delta increases and the original hedge is no longer sufficient. To remain neutral, the market maker must buy more futures. That new buying can push price higher; the higher price increases Delta again, requiring another hedge adjustment.
That is why the arrows form a loop: buy a Call → market maker buys futures to hedge → price rises → Delta increases → market maker buys more futures.
The GEX bars on the right can be understood as the accumulation of countless such loops at different price levels. When options positions cluster around certain strikes, hedging demand clusters there as well, creating the structure we see. GEX is not a mysterious signal. It is the trace left on the market when “buy a Call → hedge → price changes → hedge again” happens repeatedly.
At bottom: every price move changes hedging demand, and every change in hedging demand feeds back into price. Under a negative-Gamma configuration, that feedback can amplify a rise.
The key point: when you buy a Call from a market maker, the other side is not “betting that you will lose.” It cannot afford to bet on direction; it must mechanically trade futures to hedge. That is the source of the subsequent flow.
You think you are betting against the market maker. The market maker is simply running its program.
Principle 3: Net GEX and the GEX Ratio
Net GEX:
Net GEX = Sum of all Call GEX + Sum of all Put GEX
        = Total Call GEX − |Total Put GEX|   (Put GEX is negative)
- Net GEX > 0 → Call side dominates → positive-Gamma regime → market makers tend to sell rallies and buy declines → volatility is dampened
- Net GEX < 0 → Put side dominates → negative-Gamma regime → market makers tend to buy rallies and sell declines → volatility is amplified
GEX ratio, as a secondary reading:
Ratio = Call GEX ÷ (Call GEX + |Put GEX|)
| Ratio | Meaning |
|---|---|
| > 0.5 | Calls dominate; the market is relatively stable |
| < 0.5 | Puts dominate; the market is relatively volatile |
The ratio is not a trading signal. It is a quick thermometer for the structural balance between the two sides.
A numerical example, purely for illustration:
Suppose SPX is near 6800, and at one strike the GEX figures are:
- Call GEX = +500 (green and positive)
- Put GEX = −200 (red; Put GEX is recorded as negative)
Add them directly:
Net GEX = (+500) + (−200) = +300 → positive → a positive-Gamma bias
To see the green bar's share, compare absolute magnitudes:
Ratio = 500 ÷ (500 + 200) ≈ 0.71 → greater than 0.5 → Calls dominate
How to read it: Net GEX is positive and Calls dominate, so around 6800 market makers are more likely to sell rallies and buy declines, potentially suppressing volatility. This describes the structure. It does not say that 6800 must rise or fall.
Important limitations:
- The area around spot matters most. Gamma is greatest near ATM and the influence of distant strikes falls rapidly. In 0DTE, GEX is exceptionally concentrated near the current price.
- In plain language: a large green wall means market makers behave more like a shock absorber; a large red wall means they behave more like an accelerator.
Practical Insight 1: Gamma Flip—the Reference Line Where Character Changes
A GEX distribution contains a special level called the Gamma Flip:
- Price above the Gamma Flip → positive-GEX region → the market tends toward stability and mean reversion
- Price below the Gamma Flip → negative-GEX region → the market tends toward acceleration and trend expansion
One qualification matters: Gamma Flip is not a universally standardized academic indicator with exact predictive power. It is closer to a term used by services such as SpotGamma. In my own experience, it can be treated as an approximate reference line where the market changes from stable to agitated. It is not support or resistance.
Some platforms—including SpotGamma—mark a line called the Volatility Trigger. Its meaning is similar to Gamma Flip: both describe a switch from stable to volatile conditions. It is often drawn slightly above the Gamma Flip, like the last relatively stable defensive line.
Your platform may display only one line. The label is not important.
Remember this: above the line, think damping; below it, think acceleration. I use it as a reference for a change in character, not as support or resistance like a Call or Put Wall.
Do not treat the Gamma Flip as support. It does not say, “Price will bounce here.” It says, “Beyond here, the market's character may change.”
There is another common misconception to remove: the Gamma Flip is not a fixed line engraved in the market.
Whether Gamma is currently positive or negative is calculated from the entire options chain at that moment. The Gamma Flip is simply the price where that net value changes sign.
It is continuously recalculated and moves with Volume, OI, IV, and time. Today's Flip is not yesterday's; the morning's may not be the afternoon's.
Different platforms use different methods—OI or Volume, net or gross—so their Flip levels, and even their reading of the current sign, may disagree.
To judge whether the market is currently in a positive- or negative-Gamma regime, use the live value from the platform you are reading, not a fixed number carried over from another moment.
The Gamma Flip is alive. Do not nail it to one price.
Practical Insight 2: GEX Extremes—What I Watch When the Data Looks Worst
Intraday Volume GEX can sometimes reach a deeply negative extreme—on the order of −1000B, for example.
Textbook logic says negative Gamma produces pro-cyclical hedging, so volatility should expand and a decline should accelerate.
But in the January 23 review in Chapter 8, I observed another possibility.
If an extreme appears while price stops making new lows and GEX begins to converge back from the extreme, I become alert to possible seller exhaustion. The hedging-related selling may already be deeply crowded, making short covering more likely than another immediate collapse.
This does not mean that an extreme guarantees a reversal:
- January 23: an extreme + price stabilization → in hindsight, the bottoming area
- March 26: structural failure → an extreme could become even more extreme
To me, a GEX extreme is an emotion thermometer and crowding alert. It must be read together with price action. If I look only at −1000B, I can easily fool myself into thinking I have the answer.
An extreme tells you that the trade is crowded. Crowding can still intensify. Price must stop following before the message becomes useful.
Follow One Map Through an Entire Session: A 6800 Example
The following is a fictional but typical 0DTE timeline. It connects the earlier concepts into a single routine from premarket to close. Every level is illustrative.
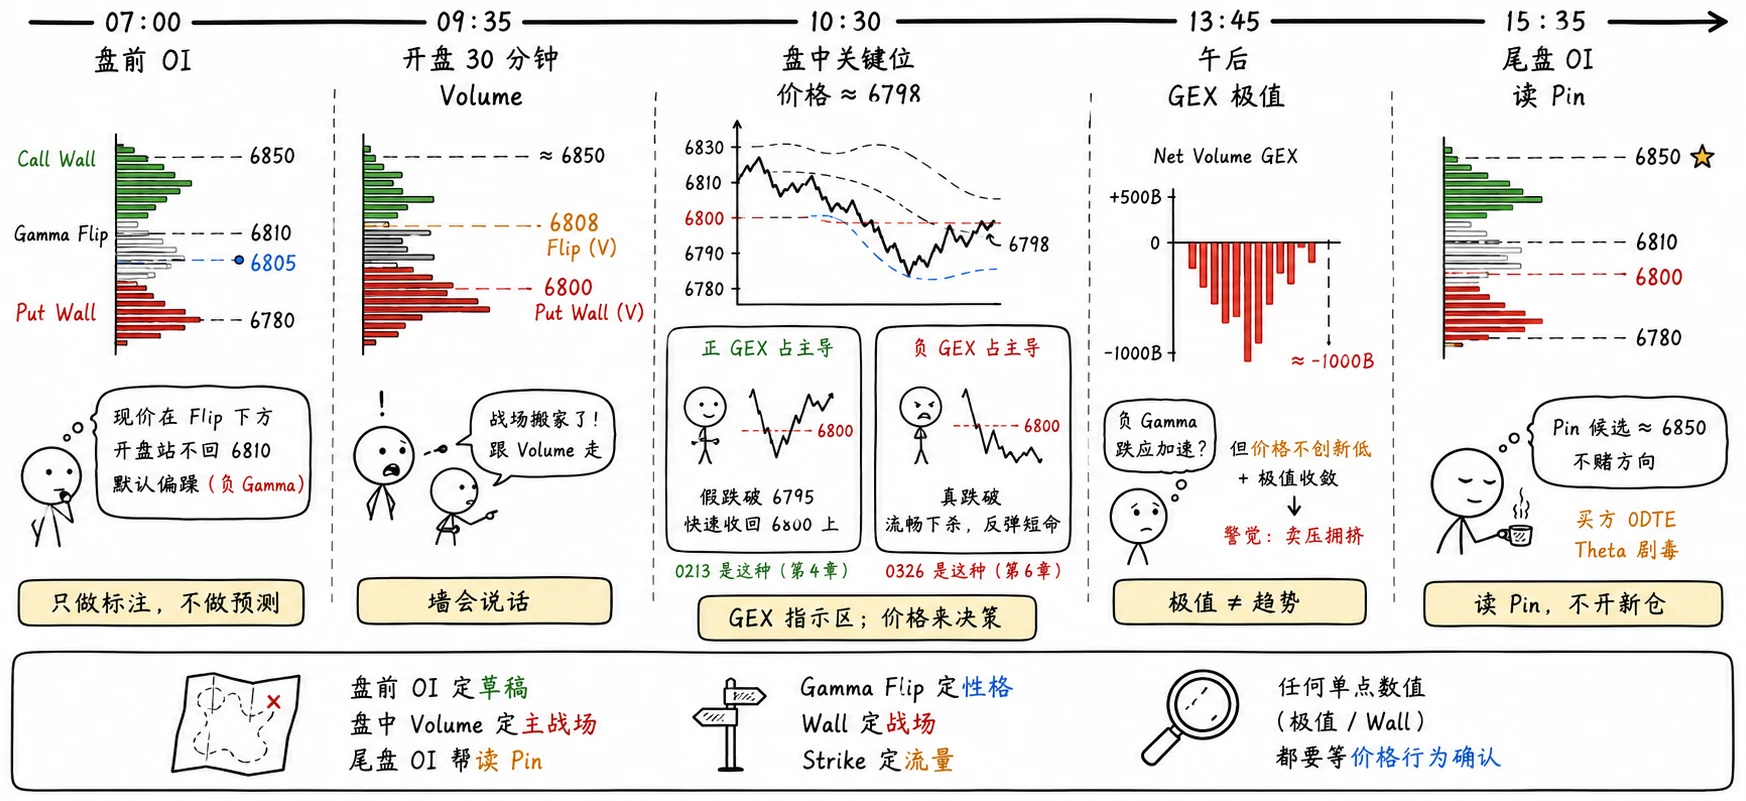
Begin with the overview above, then follow the stages below: the premarket OI draft, the Volume-defined battleground after the open, and the Pin near the close. The figure shows at a glance how options walls can change through the day.
07:00 Premarket—Open OI GEX and Mark Three Lines
Call Wall (OI)    ≈ 6850   ← largest green bar overhead
Gamma Flip (OI)   ≈ 6810   ← character switch
Put Wall (OI)     ≈ 6780   ← largest red bar below
Current futures   ≈ 6805
My reading: futures are below the Gamma Flip. If price cannot reclaim 6810 after the open, I prepare for an agitated, negative-Gamma-side market, not a stable range.
Premarket work is marking, not prediction. OI is last night's terrain. The weather can change after the open.
The three premarket lines are a draft. Once the market opens, let Volume speak.
09:35 After the Open—Switch to Volume GEX and Ask Whether the Battlefield Moved
Volume concentration     → heavy trading near 6800
Volume Put Wall          → 6800, not the premarket 6780
Volume Gamma Flip        → 6808, slightly below the OI level at 6810
My reading: the battle is now at 6800. The premarket 6780 OI wall is downgraded to a reference; the primary field follows Volume.
This is one of the most common 0DTE beginner mistakes: holding on to the premarket OI wall after the first 30 minutes of Volume have moved elsewhere.
The first 30 minutes reveal the day's real battlefield. Do not defend an outdated premarket map.
10:30 Intraday—Price at 6798, Near the 6800 Volume Put Wall
- Bollinger Bands: price touches the lower band
- Net Volume GEX: still negative, but the Put GEX bar below 6800 is thick
Two readings can lead to opposite outcomes:
| If positive GEX dominates | If negative GEX dominates |
|---|---|
| False break below 6795 → quick reclaim above 6800 | Genuine break → clean selloff and short-lived rebounds |
| February 13 followed this pattern; see Chapter 4 | March 26 followed this pattern; see Chapter 6 |
GEX does not make the decision for you. It tells you that this is a zone of concentrated hedging flow, where it is worth waiting for price to prove whether the move is a liquidity sweep or a genuine breakdown.
13:45 Afternoon—Volume GEX Reaches an Intraday Extreme of −1000B
The textbook says negative Gamma should accelerate a decline.
But if price stops making new lows while GEX converges back from the extreme, I become alert to crowded selling pressure, as on January 23 in Chapter 8. It is not a license to keep shorting without thought.
You must watch price, not the number alone.
An extreme says, “This is crowded.” Price's refusal to follow is what may signal a reversal.
15:35 Near the Close—OI Regains Weight; Read the Pin
Today's Volume battle    → 6800–6850
Remaining OI concentration → 6850 Calls still thick
My reading: the probability of a Pin near 6850 has increased, but I do not bet on its direction. For a 0DTE buyer, Theta is toxic at this hour; see “Charm” in Chapter 3. The risk-reward of a new position is often poor.
Takeaways from the day:
- Premarket OI provides the draft, intraday Volume defines the battlefield, and late-day OI helps identify a Pin
- Gamma Flip describes character, walls describe the battlefield, and strikes locate the flow
- Every isolated number—an extreme or a wall—requires confirmation from price action
Three Intraday Uses of GEX
Scenario 1: Positive-GEX Range—Price Tends to Be Pinned
Characteristics: GEX is positive, volatility falls, and price oscillates within a narrow range.
Market-maker behavior: sell rallies and buy declines; hedge against the move.
My reading: a large one-way move is less likely. Price is more likely to grind between the Call Wall and Put Wall.
This does not mean the market must remain in a range. It means the structure increases the probability that volatility will be suppressed.
Scenario 2: Negative-GEX Region—Price Can Accelerate
Characteristics: price falls below the Gamma Flip, GEX turns negative, and volatility rises sharply.
Market-maker behavior: buy rallies and sell declines; hedge with the move—exactly the opposite of what many retail traders expect.
My reading: apparent support can be paper-thin. Bounces die quickly and declines travel cleanly. I do not rush to catch the falling knife; I wait for confirmation across several dimensions before considering a direction.
Scenario 3: Key Walls—the Day's Battlefield
The Call Wall, Put Wall, and Gamma Flip mark important points in the GEX structure.
- As price approaches them → hedging pressure concentrates → a magnet effect or pressure zone may form
- If price breaks through on volume → outside force has overcome the hedging wall → a chain reaction may follow
One Crucial 0DTE Question: Which GEX Should You Use?
There are two common GEX inputs—OI GEX and Volume GEX. For intraday 0DTE, I focus mainly on Volume GEX.
This is not a minor technical distinction. It can change the entire reading.
Unless stated otherwise, the trading sections of this book use Volume GEX, Volume Call Wall, and Volume Put Wall.
If your platform displays OI-based values, they may differ substantially from Volume-based intraday values. Before switching platforms, first establish which version you are viewing.
OI GEX vs Volume GEX
| Dimension | OI GEX | Volume GEX |
|---|---|---|
| Calculation base | Gamma × open interest × 100 | Gamma × the day's Volume × 100 |
| Represents | Historical positions + overnight inventory | Positions being created today |
| Response speed | Slow; complete OI updates after the close | Fast; changes intraday |
| Metaphor | Mountains on the terrain map | Today's live weather |
| Best use | Premarket structure and broader framework | Intraday 0DTE trading |
The factor of 100 is the SPX contract multiplier.
Why Volume GEX Matters in 0DTE
Much of the Gamma pressure in 0DTE comes from positions being traded today, not inventory left from yesterday.
Consider a classic wrong-map scenario. Last night's OI data shows a thick 6850 Call Wall, a large green bar on the OI GEX chart. But after today's open, new positions trade heavily near 6800. Volume GEX now says that the true Gamma pressure has moved to 6800. If you watch only OI GEX, you are navigating today's road with yesterday's map.
My intraday default for same-day options is Volume GEX.
OI GEX describes yesterday's terrain. Volume GEX describes what market makers are actually hedging today.
0DTE is a sprint. A sprinter does not dress for yesterday's weather.
Intraday Rhythm: How Do OI and Volume Change in Importance?
Why does OI matter more near the close?
0DTE options expire at the close. During the final half hour, market makers increasingly hedge contracts that remain open and are about to expire.
- Volume GEX tells you where the battle occurred today
- OI GEX for the day's options tells you where positions remain open into expiration—more relevant to the Pin
A useful rhythm, not a fixed formula:
| Time | Volume GEX | OI GEX | How I use them |
|---|---|---|---|
| Premarket | Low | High | Mark the broad overnight structure |
| Open to ~30 minutes | Rising | Declining | See whether the center of trading moves away from the premarket wall |
| 10:00–15:00 | Primary | Secondary | Follow Volume-based Call and Put Walls |
| 15:00–15:30 | Still important | Begin watching | Compare both for possible Pin levels |
| 15:30–15:45 | Secondary | Clearly rising | Give more weight to OI walls |
| 15:45–16:00 | Reference | High—the Pin phase | Look for confluence between remaining OI and the day's Volume |
In one sentence: follow Volume intraday; invite OI back for the final 30–15 minutes. See the Appendix Intraday Rhythm Table for the full checklist.
0DTE GEX Changes in Real Time—but You Do Not Need to Refresh Every Second
The Volume GEX of an individual strike changes with nearly every trade. Every new 0DTE Call slightly adjusts Gamma pressure at that strike.
But large levels such as the Call Wall and Put Wall change much more slowly.
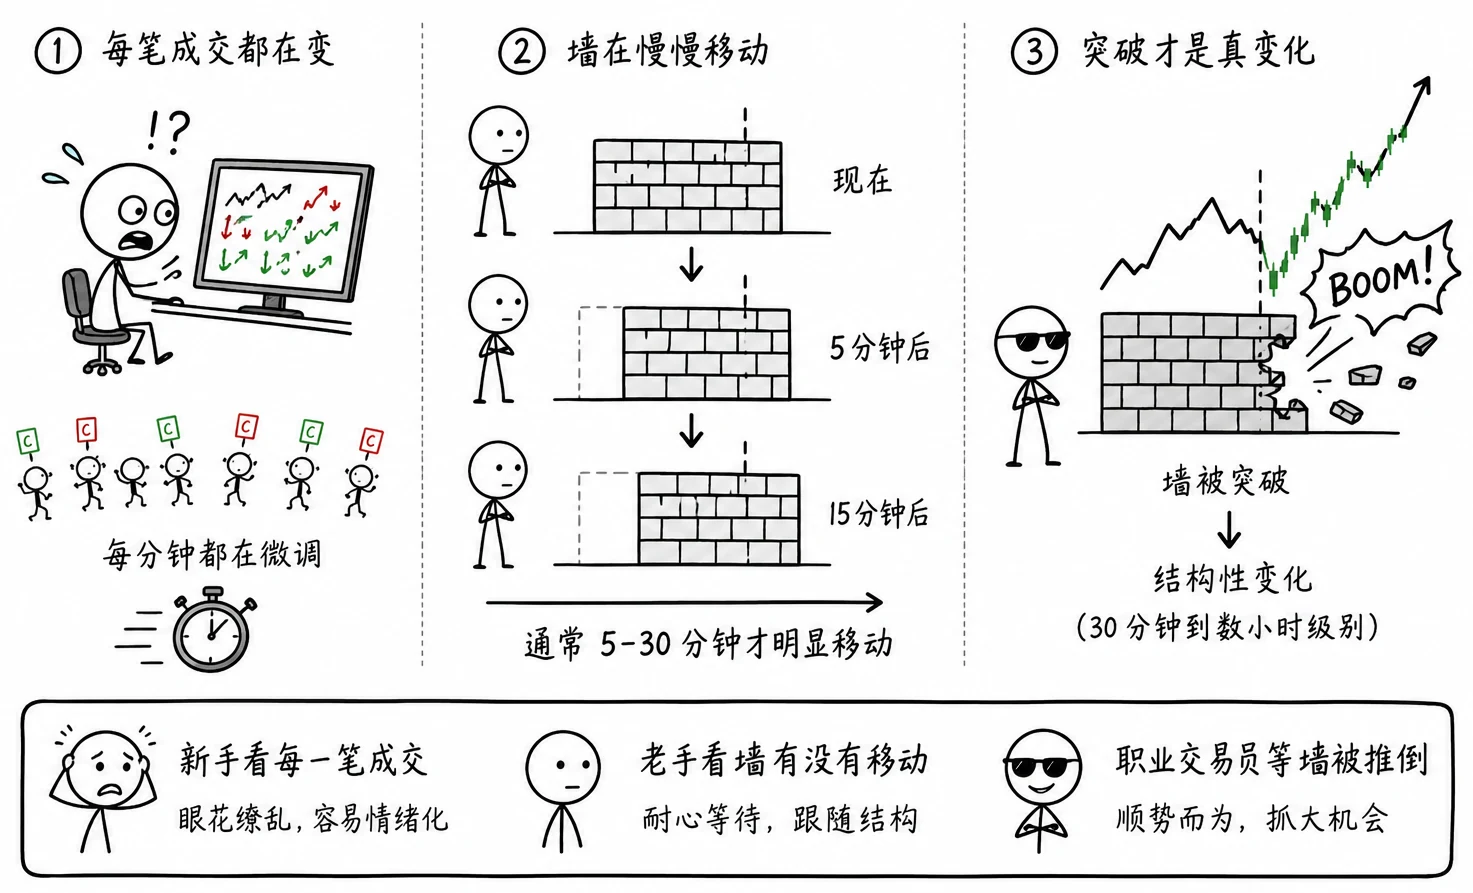
Think of GEX as changing at three speeds. One strike's GEX changes fastest, often minute by minute. The locations of major Call and Put Walls change more slowly, usually becoming visibly different over 5–30 minutes. A true break of a major wall, where the structure changes character, often develops over 30 minutes to several hours. A trembling bar does not mean the wall has moved. The latter two changes are the ones that should alter your view.
Practical implications:
- Do not refresh the GEX map every second; it will only make you anxious
- I do refresh deliberately when:
- Price comes within roughly 10 points of the Call Wall or Put Wall
- Price crosses the Gamma Flip
- Volume surges at a particular strike
- An event release changes IV and may alter the Gamma distribution
A moving Call Wall does not mean the wall disappeared. It may simply have shifted a few points. A panicked change of direction often pays only in slippage.
(See “Options Walls” in Chapter 3 for how walls move.)
Using Both Types of GEX: Divide the Day into Jobs
If you remember only four periods:
| Period | What I emphasize |
|---|---|
| Premarket | OI GEX—where did yesterday's walls remain? |
| Main session, roughly 10:00–15:00 | Volume GEX—where is the live center of market-maker hedging? |
| Final hour | Volume remains important; begin comparing OI |
| Final 30–15 minutes | OI gains weight—read OI Call and Put Walls for the Pin and compare with Volume |
OI GEX is the map and Volume GEX is the weather. Read the wind intraday; in the final half hour, check what remains open on the map.
Five Common Traps When Beginners Read Options Walls
The trade reviews in later chapters contain nearly all of these mistakes. Before using a map, understand what it can and cannot do.
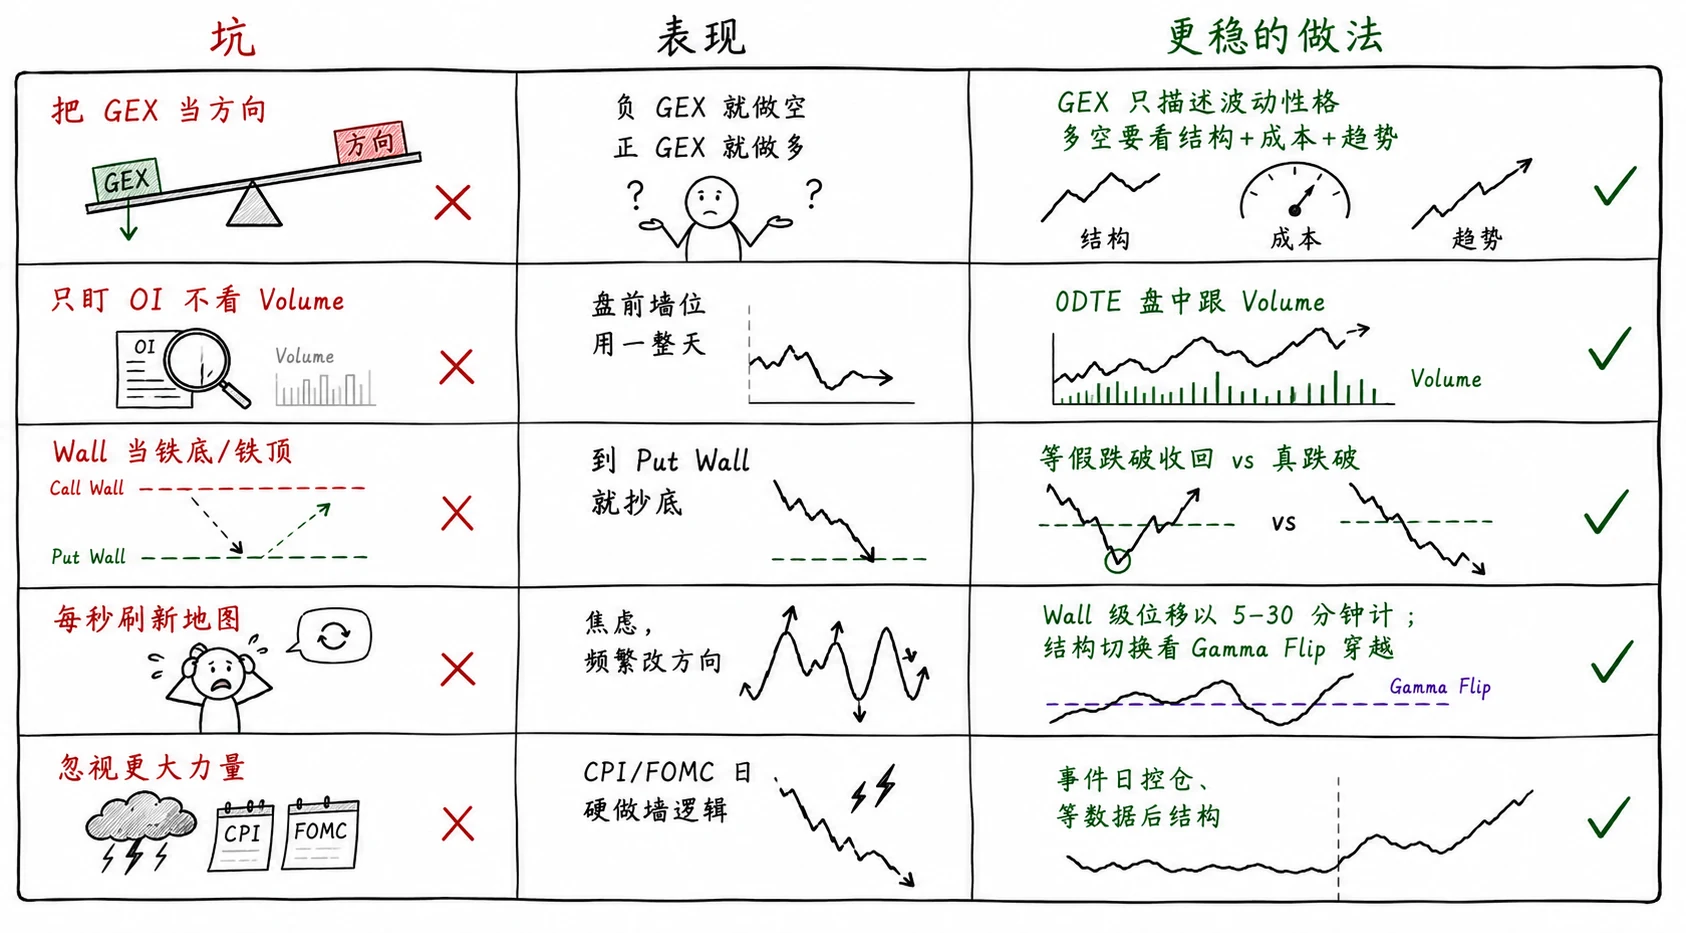
Trap 1: treating GEX as direction. Some traders immediately short when they see negative GEX and buy when they see positive GEX. They forget that GEX describes the character of volatility, not direction. A sounder approach is to examine structure, cost, and price action before acting.
Trap 2: watching OI while ignoring Volume. Some traders hold on to premarket walls as though those levels must remain valid all day, ignoring changes in Volume and actual intraday liquidity. 0DTE is not a premarket prediction game. It requires following the evolving structure and transaction rhythm.
Trap 3: treating walls as an iron floor or ceiling. The Put Wall is not guaranteed support, and the Call Wall is not guaranteed resistance. A wall expresses probability, not certainty. Waiting to see whether a false break is reclaimed helps distinguish a sweep from a genuine breakdown.
Trap 4: refreshing every second and constantly changing your mind. The market is not decided in one instant. Major wall locations typically adjust over minutes; a meaningful Gamma Flip crossing can change the structure. Patience is central.
Trap 5: ignoring a larger force. On an event day such as CPI or FOMC, forcing a wall-based trade without controlling position size can be disastrous. Waiting for the release and for the structure to become clear is basic risk management.
Trading is not about running fastest. It is about finding a place to stand by distinguishing rhythm within disorder.
A map describes the terrain. During an earthquake, the terrain no longer has the final word.
Correcting Common Misreadings
| ❌ Misreading | ✅ Better interpretation |
|---|---|
| GEX predicts whether price will rise or fall | GEX is a structural description of whether volatility is more likely to be suppressed or amplified |
| Negative GEX is bearish; positive GEX is bullish | Negative GEX amplifies volatility; it is not a directional signal |
| Price can never cross the Call Wall | A Call Wall is a concentration of pressure, not an absolute ceiling |
| GEX is fixed at the open | GEX is dynamic and changes with price and IV; use current data |
| GEX makes profitable trading easy | It adds one dimension of information; execution and psychology remain decisive |
| OI GEX is enough for 0DTE | Prefer Volume intraday; OI gains weight in the final 30–15 minutes for the Pin |
| Volume GEX and OI GEX are the same | They represent flow vs inventory; their relevance changes through the session |
How I Use Options Walls
My daily GEX workflow is roughly this. Chapter 3 expands on combining the three levels and recognizing wall failure.
- Premarket: open the OI-based GEX distribution and mark the Call Wall, Put Wall, and Gamma Flip
- Set the regime: is price above or below the Gamma Flip? Decide whether to emphasize range behavior or trend behavior
- Intraday: switch to Volume GEX; as price approaches a key wall, look for confluence with VWAP and price action
- Final 30–15 minutes: give more weight to OI GEX Call and Put Walls and compare with Volume for a possible Pin; see Chapter 3
- What I do not do: I do not buy merely because GEX is positive, and I do not short merely because price reached the Call Wall
To me, GEX is a weather forecast, not a navigation command.
The forecast says rain is possible, so you carry an umbrella. It does not say that you must leave the house.
Before You Close the Map
Try answering these five questions in your own words. If you cannot, this chapter is worth reading again.
- Why does a market maker trade futures after a customer buys a Call? To hedge Delta, not to bet against the customer
- How does market-maker behavior differ under positive and negative GEX? Sell rallies and buy declines vs buy rallies and sell declines
- When are OI GEX and Volume GEX most useful? Premarket/near the close vs the main intraday battlefield
- What questions do Gamma Flip, Call Wall, and Put Wall answer? Character / overhead pressure / support below
- Why can a GEX extreme not serve as a standalone reversal signal? Compare January 23 with March 26; price must confirm
Remember one more thing: walls do not stay where they were drawn. OI, Volume, and time can move them, collapse them, or allow price to drive straight through.
What I Want You to Take from This Chapter
- Market makers are not “the house.” They are liquidity machines compelled to hedge
- Positive GEX = shock absorber—sell rallies, buy declines; negative GEX = accelerator—buy rallies, sell declines
- GEX does not answer up or down. It describes whether volatility is more likely to be suppressed or amplified
- Gamma Flip is a character switch, not support or resistance, and it moves
- Follow Volume GEX intraday in 0DTE; bring OI back into the picture near the close
- Walls move, collapse, and break. Never treat them as an iron floor or ceiling
Notes from My Journal
While writing this chapter, I kept remembering how confused I was when I first encountered GEX:
The first time I heard “market makers are not your opponent,” I was skeptical. Only after seeing enough traces of their hedging did I believe it.
Positive GEX is a speed bump; negative GEX is the gas pedal. That metaphor stayed beside my screen.
GEX does not ask whether price will rise or fall. It asks whether volatility will be suppressed or amplified. Directional traders rarely understand that sentence until a deep V-shaped recovery squeezes their shorts.
I stepped into every one of these traps while learning GEX:
The first time I saw a GEX chart, the screen was full of bars and I had no idea which mattered. Eventually I learned to begin with the largest green bar and the largest red bar.
I treated the Gamma Flip as support. When price broke below it, I bought the dip and watched the decline deepen. Only later did I understand: the line was not support; the market's character had changed.
Premarket OI walls, intraday Volume walls, OI again near the close. I wrote those three phases beside my screen.
At an extreme, ask whether price is still following. After January 23, that sentence entered my review template.
This chapter introduced market makers, the difference between positive and negative Gamma, the division of labor between OI GEX and Volume GEX, and a full-day routine for reading the map.
In the next chapter, we return to the three lines—Call Wall, Put Wall, and Gamma Flip. We will see how to combine them, when they fail as walls collapse, and why the final half hour of 0DTE can stop behaving rationally under Vanna, Charm, and Pin dynamics.