Chapter 5 · Work Before the Open: Options Walls, VWAP, and Price Action
Opening verseTo the Tune of Cai Sang Zi · Watching the Mind
Watch the market with a cool eye; ask not whether it will rise.
Walls rise and fall, tides leave and return;
without joy or grief, the page unfolds.
A thousand hidden currents gather into lines,
painted red and green.
Ask neither victory nor defeat;
one small boat crosses the boundless sky.
When I first traded 0DTE, I thought the best traders could predict before the open whether the market would rise or fall. Later I learned that the most consistent traders do not make directional bets premarket. They arrange several possible scenarios in their minds, then wait for the market to choose after the open.
This chapter describes what I do in the half hour before the open: how I read the premarket, use the cost line—VWAP—and decide when price action and structure truly point in the same direction.
Three Things I Check Before the Open
The 30–60 minutes before the open are the quietest and most important part of the day.
I do not spend them staring at news or guessing direction. I do three things: read the options-wall map, mark key levels, and check the calendar.
Everything later—VWAP, GVP, and contract selection—rests on first reducing the day to several possibilities. I am framing the range, not fixing the direction.
Why three things instead of thirty? SPX 0DTE offers infinite information: news, social media, Level 2, ten indicators. I tried watching everything. The result was simple: I became more confused intraday. These three tasks serve one purpose:
Compress “the unknown” into “a few possibilities.” Is this a shock-absorber day, an accelerator day, or an event day? Where are the walls?
Once the session begins, I only confirm or reject those possibilities. I do not invent a new theory inside the noise.
I used to watch news, social media, Level 2, ten indicators, and five timeframes. I did not become more accurate. Every small spike could pull me away from the plan.
More information creates more reasons; more reasons make one judgment harder to hold. Eventually I forced myself to subtract: three things before the open, three things during the session. Not because everything else is useless, but because attention is finite—especially in 0DTE, where money is measured by the minute.
Seeing less made the picture clearer.
First: the Options-Wall Map
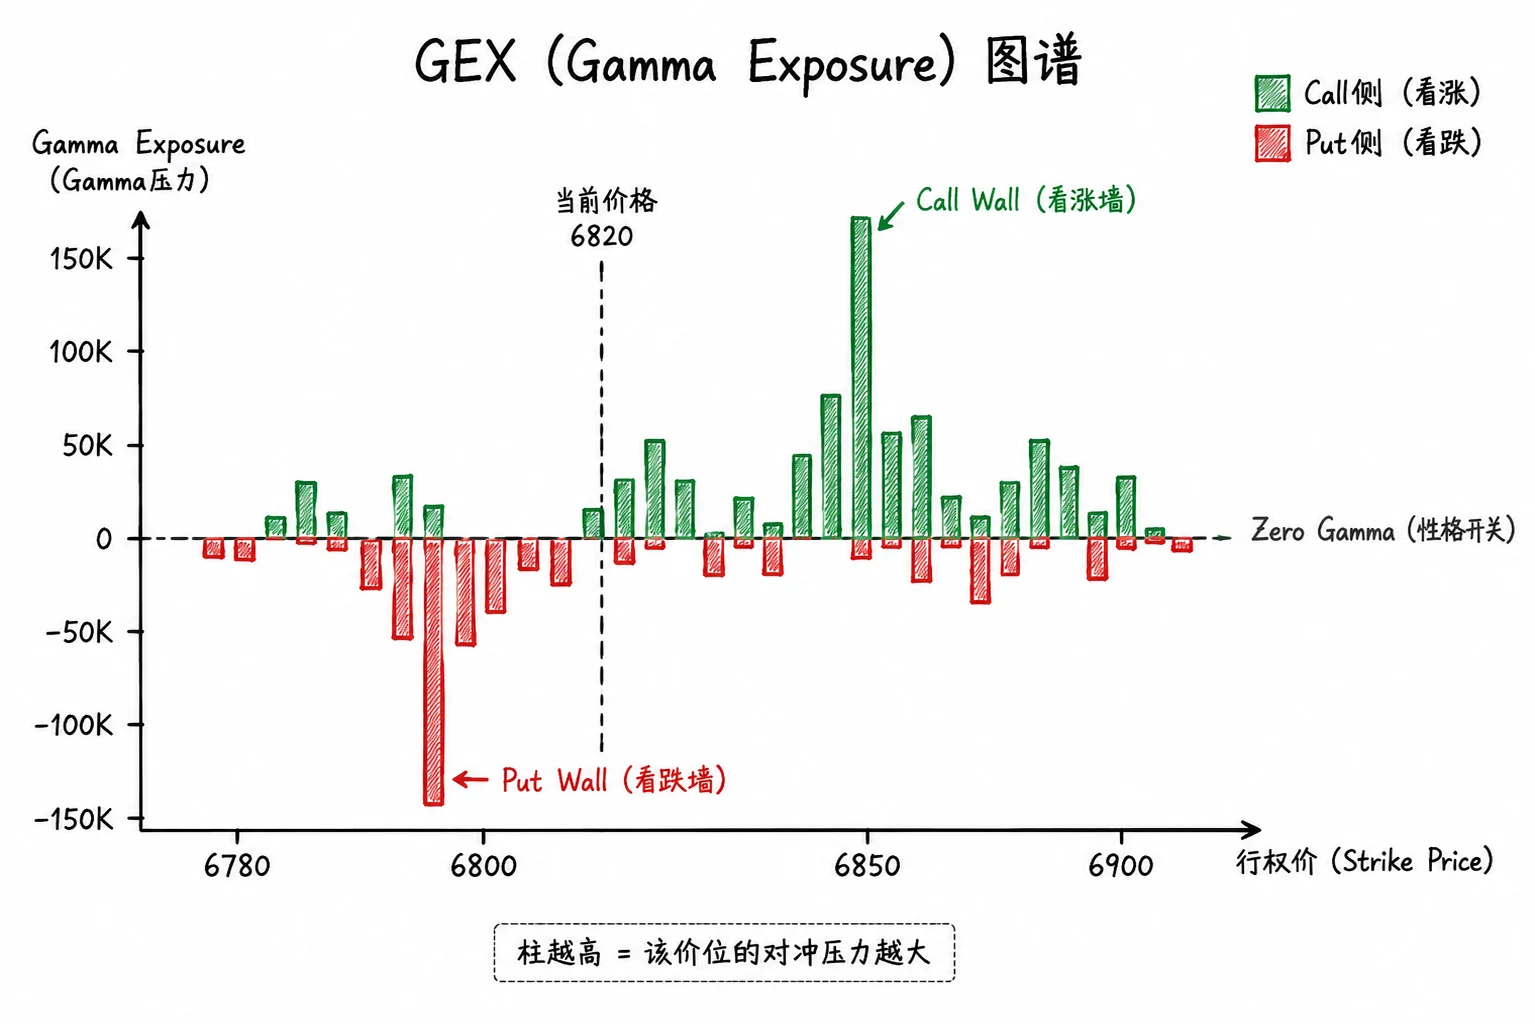
Some brokerage feeds and specialist options platforms display the day's options-wall structure before the open. It looks roughly like Figure 5-1. The Call Wall, Gamma Flip, and Put Wall frame the day's ceiling, floor, and character switch.
What do I mark?
First, one point must be clear: I do not use premarket OI to predict direction.
OI is overnight inventory and is often too stale for intraday precision. It gives me only a rough draft: approximate Call Wall, Put Wall, Gamma Flip, and the possible width of the day's range.
I wait 10–30 minutes after the open before deciding the primary structure. By then, Volume GEX—walls built trade by trade during the current session—has begun to form. It tells me where the main battlefield is and whether the market is damping or accelerating. I do not ask the premarket OI draft to answer that question; see Chapter 2.
The purpose of premarket work is not prediction. It is to frame the map, then let Volume fill it in after the open.
At minimum, I extract four numbers:
- Call Wall
- Put Wall
- Gamma Flip
- The current price relative to all three—above, between, or below
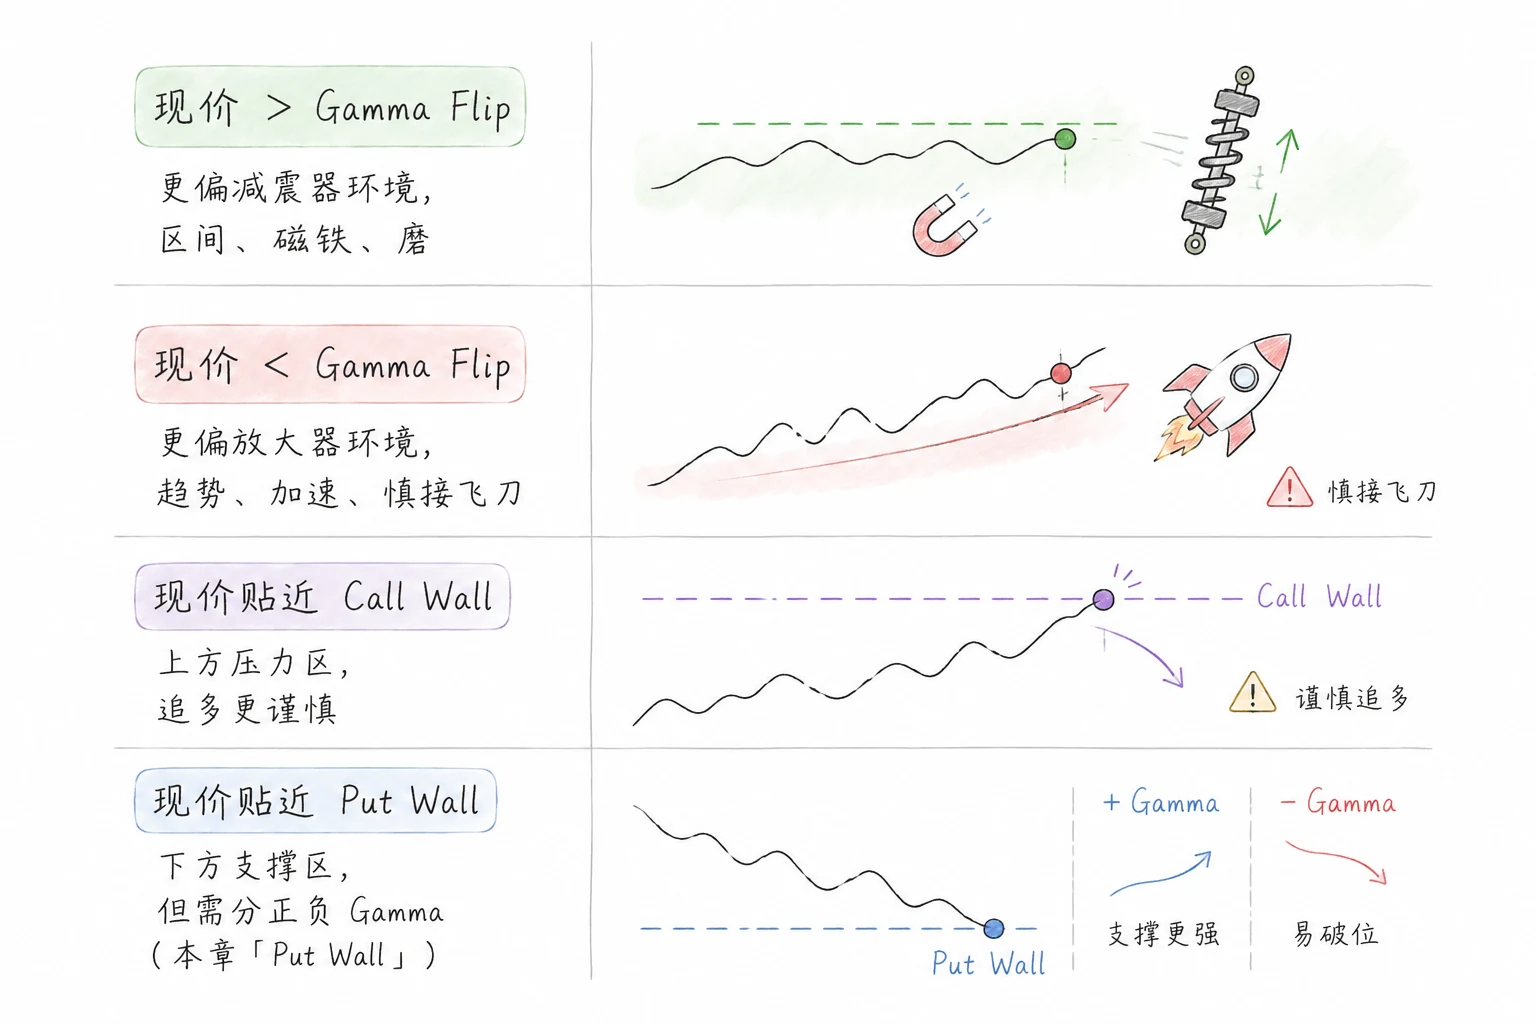
What questions am I answering?
| Position | Reading of character, not a prediction |
|---|---|
| Spot > Gamma Flip | More like a shock-absorber regime: range, magnet, grind |
| Spot < Gamma Flip | More like an accelerator regime: trend, acceleration, caution when catching a falling knife |
| Spot near Call Wall | Overhead pressure; greater caution about chasing a long |
| Spot near Put Wall | Support below, but interpret it differently under positive and negative Gamma |
Premarket OI vs intraday Volume:
| Period | GEX I use |
|---|---|
| Premarket | OI GEX—only a draft of approximate walls and range; not a directional forecast |
| From 10–30 minutes after the open | Volume GEX—let current trading build the real walls before defining the battlefield |
| Final 30–15 minutes | OI regains weight—compare it for the Pin; see Chapter 3 |
The three premarket levels are a draft. They are not fixed at 9:30; current Volume may confirm or overturn them over the next 10–30 minutes.
Common mistakes:
❌ Fix GEX at the open and never look again
✅ GEX is dynamic in 0DTE; refresh near key levels
❌ GEX makes everything else unnecessary
✅ GEX is the first dimension, not the only one
Second: Mark the Key Levels
After marking the three GEX levels, I add several items to the same chart: the previous day's high and low—short-term consensus boundaries, not a holy grail; a place in my mind for VWAP, which begins only after the open; and vertical lines for the day's events, such as CPI at 8:30 or FOMC at 14:00. The result is today's premarket map.
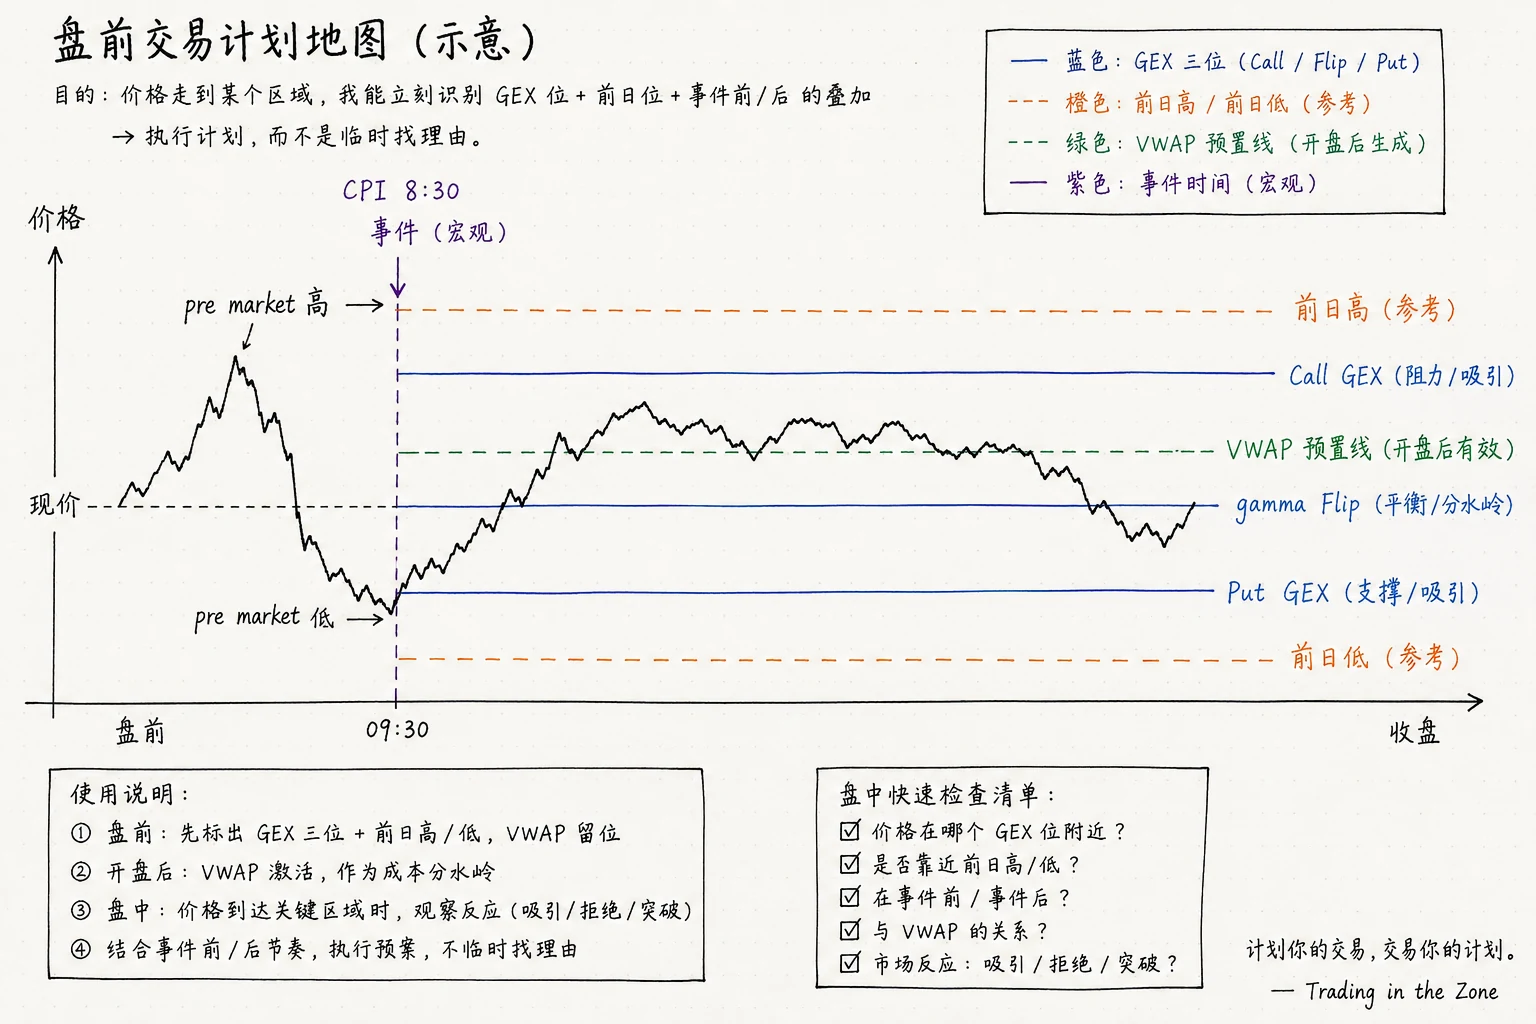
I spend a few minutes drawing this map before every session. It is not designed to predict the market. Its purpose is precisely to remind me not to predict.
Markets do not obey opinions. They rise and fall, break out and reverse. No conviction can remove the uncertainty of the next candle. Before price begins to move, I would rather prepare a map.
The map contains no answer, only locations: Call Wall, Gamma Flip, Put Wall, prior high and low, CPI, FOMC. They are road signs waiting quietly in darkness.
Intraday price is a traveler. It may stop at a sign, turn away, or pass through without hesitation. My work is not to order it in one direction. I observe what choice it makes in each important region.
Many trading errors are emotional rather than technical. A fast rally invites a chase; a sudden decline creates panic; the plan disappears and trading becomes improvisation. The market rarely rewards improvisation. It rewards preparation.
The map matters because when the future arrives, I already know where to look. At the Gamma Flip, I watch the boundary between balance and imbalance. Near the Call Wall, I watch for attraction or resistance. Above the previous high, I distinguish a genuine breakout from emotional excess. Each location implies an observation; each observation implies preparation.
Trading gradually stops being a guessing game and becomes a practice of execution. I do not need to know where the market will be in an hour. I need to know: if price comes here, what will I do? If it goes there, what will I do instead?
That is the map's true purpose. It records not the market, but the trader's order in the face of the market. Good trades are not predicted. They are plans followed inside uncertainty.
Third: Check the Macro Calendar
What do I check?
- High-impact releases such as CPI, PPI, FOMC, and nonfarm payrolls
- Monthly OPEX, the third Friday of each month
- Rebalancing flows around holidays, month-end, and quarter-end
- Earnings season usually affects SPX less than individual stocks, but mega-cap earnings can still disturb the index
How do I adjust expectations on an event day?
I do not predict whether the number will be good or bad. Instead:
- IV may be elevated → options are expensive; see the Appendix Before You Trade
- The event may override structure → GEX walls can temporarily lose authority
- I mentally cut position size in half; see Chapter 7
- I do not place a large directional bet before the release; see Chapter 7
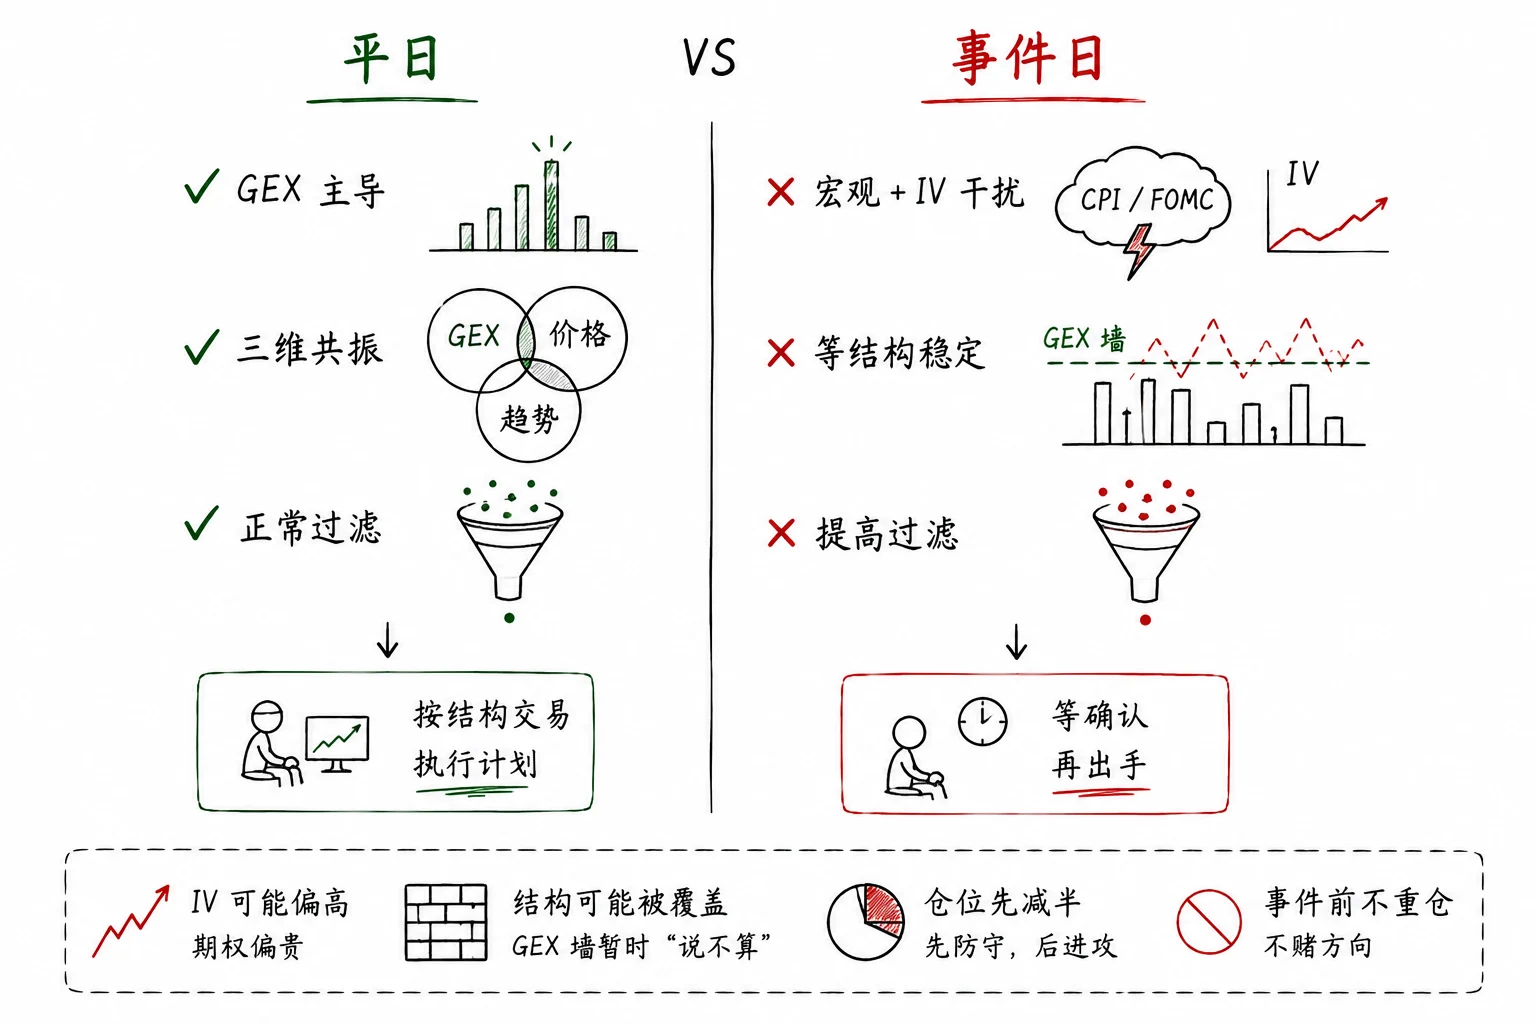
On ordinary days, GEX, VWAP, and price action—GVP—retain explanatory power. When the structure aligns, I raise the priority of acting. An event day such as CPI or FOMC is different. IV often rises in advance, making options expensive. Around the release, noise can overwhelm wall levels and the Gamma Flip.
I do not guess the result. I first control size and avoid a large directional bet. After the release, I allow the structure to reset—usually 15–30 minutes—then ask whether GEX, VWAP, and price action have realigned. Figure 5-4 contrasts the two regimes: ordinary structure on the left, higher IV interference and a higher threshold on the right.
The order of the three tasks matters. Calendar first: is this a special day? Then GEX: character and three levels. Then the map: previous high and low plus event lines. After VWAP forms, enter the normal intraday process. Risk first, structure second, detail third. Reverse the sequence and you often see the opportunity before noticing the trap.
Before, during, and after the session:
| Period | Focus |
|---|---|
| Premarket | Options-wall character, map, and calendar |
| Intraday | Above or below VWAP, wall holding or collapsing, GVP alignment |
| After the close | Review the plan against execution; see Chapter 7 |
Do not think this way before the open:
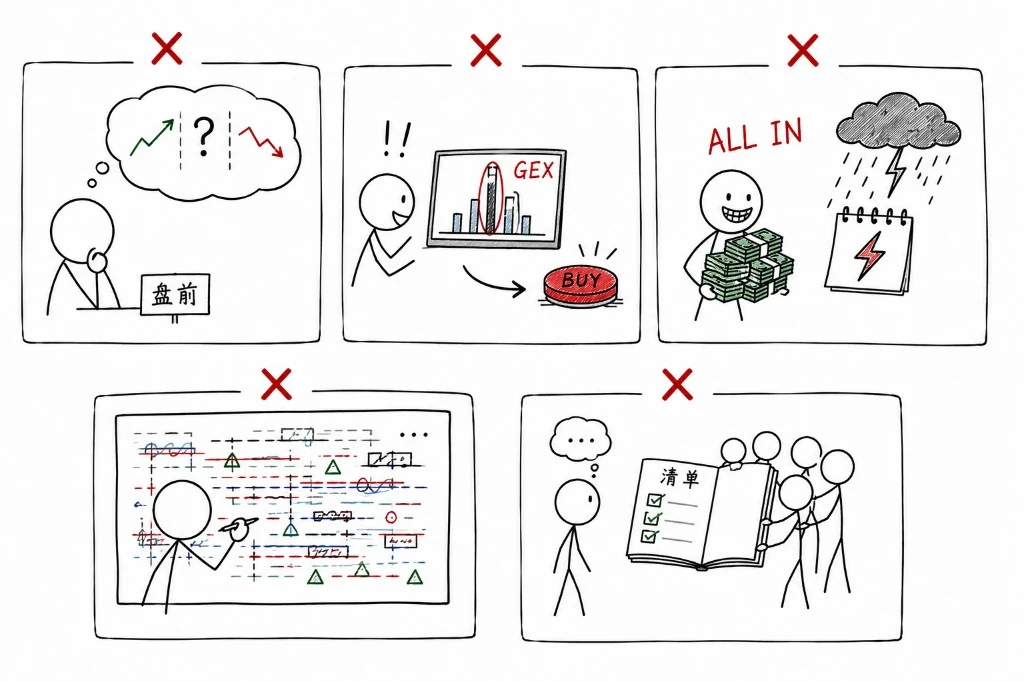
| ❌ No | ✅ Yes |
|---|---|
| Predict direction before the open | Define character and risk |
| Trade immediately after reading GEX | Use GEX as a filter, not a trigger |
| Use full size on an event day | Control size first, then discuss structure |
| Fill the map with everything possible | Keep the map sufficient, not overloaded |
| Copy someone else's premarket checklist | Rewrite the checklist in your own language |
The lesson of June 4 was that seeing clear data does not guarantee that you will follow it. Premarket work solves “Did I see it?” Trend discipline and the ability to hold solve “Did I execute correctly?” Premarket preparation cannot eliminate the second problem, but without preparation execution becomes even more chaotic.
The three premarket tasks: options walls define character, key levels define the map, and the calendar defines risk. I do not predict; I compress the unknown.
VWAP: If I Could Keep Only One Line
Let us turn to the line I am least willing to remove.
Not MACD. Not Bollinger Bands. Not an EMA.
It is VWAP—Volume-Weighted Average Price.
People often ask, “With such a complex market and so many indicators, what do you actually watch every day?”
My answer disappoints them: if I had to erase every line on the screen except one, I would keep VWAP. I still read candles and structure. But after subtracting everything optional, VWAP remains.
Three points matter:
- What VWAP is and how it differs from a moving average
- Why support or pressure repeatedly appears around VWAP
- How I use VWAP each day—and when it misleads
VWAP Is Not a Moving Average; It Is the Market's Cost Basis
Start with the essential distinction:
| Indicator | What it calculates |
|---|---|
| MA / EMA | The average of price |
| Bollinger Bands | Price + standard deviation, a volatility range |
| VWAP | The average cost weighted by Volume |
The difference is larger than it sounds.
A conventional moving average tells you the arithmetic mean of past prices. VWAP tells you the volume-weighted average price paid by participants since today's open.
The formula is simple; skip it if you wish:
VWAP = Σ(Trade Price × Volume) / Σ(Volume)
Every transaction receives weight according to its size. A high-Volume price matters more than a low-Volume price.
Why does that matter?
Because price is a number; cost basis is real capital.
Price can jump. Cost cannot pretend. If someone bought 100 contracts at 6800, the day's profit or loss is tied to the current price relative to today's cost basis—not to a 20-day arithmetic average.
Three Uses of VWAP
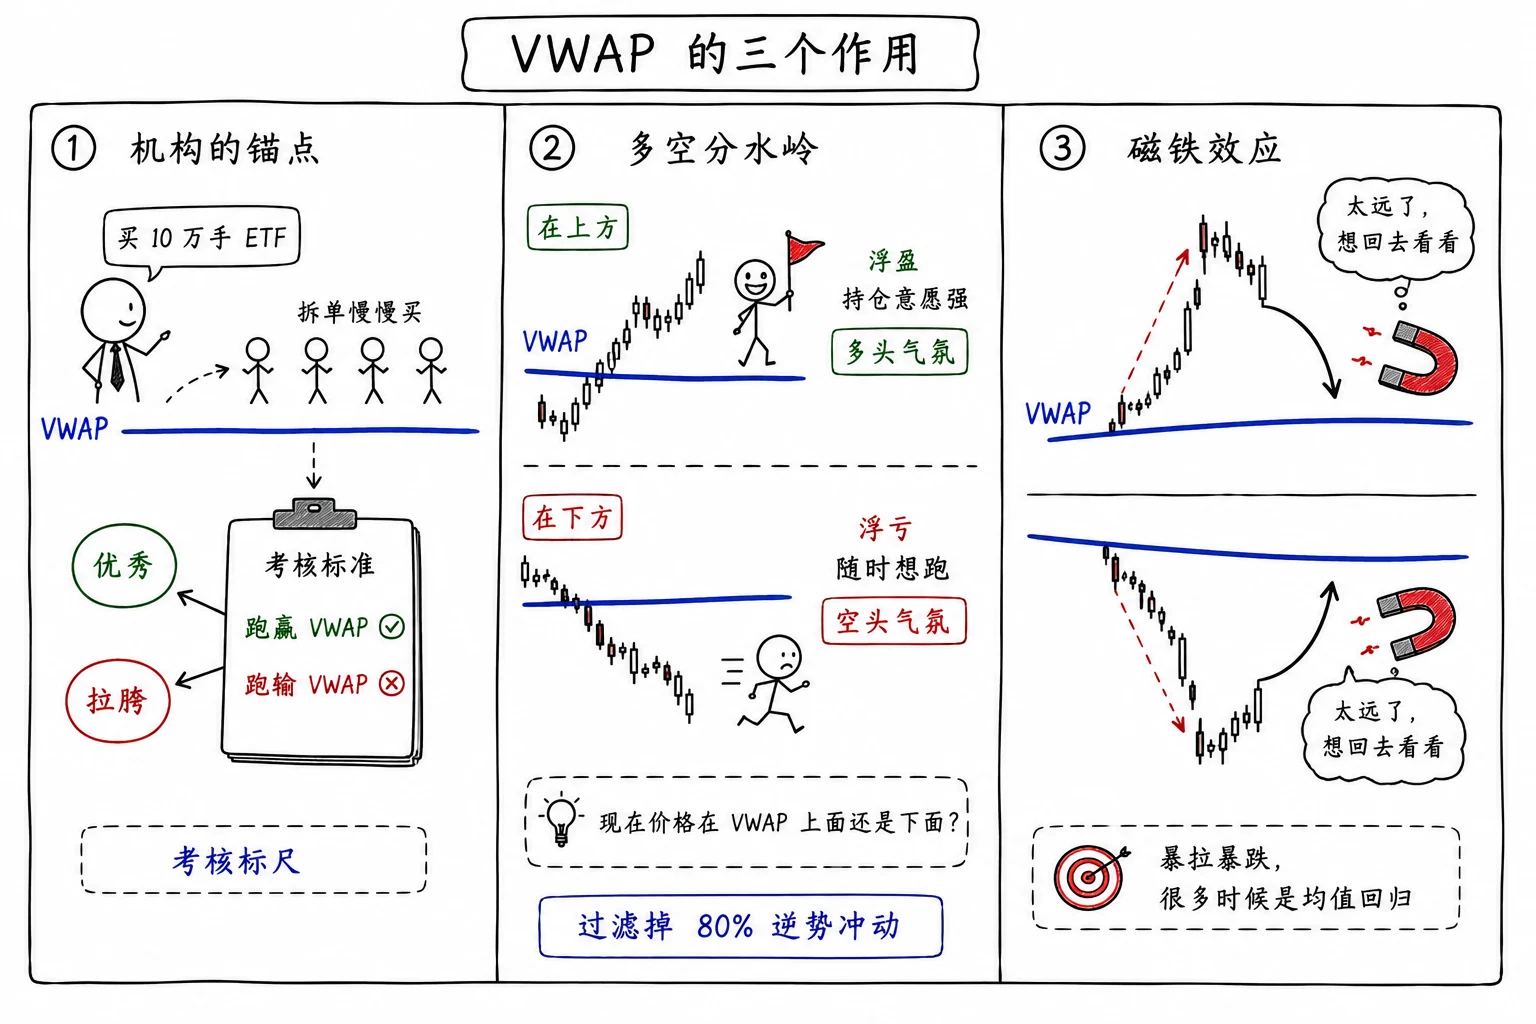
Use 1: an institutional benchmark
Large investors—pension funds, hedge funds, and market makers—commonly evaluate the execution of large orders against VWAP.
Suppose a portfolio manager receives an instruction to buy 100,000 ETF shares. The order will be divided and executed gradually. Later, the manager is asked: “Was your average fill better than VWAP?”
- Better than VWAP = bought below the market's volume-weighted average = good execution
- Worse than VWAP = paid above the average = poor execution
Institutions therefore operate naturally around VWAP. That is not coincidence; it is their benchmark.
Use 2: a divide between the sides
VWAP is the day's simplest directional dividing line:
- Price above VWAP → today's buyers are profitable in aggregate → greater willingness to hold → bullish atmosphere
- Price below VWAP → today's buyers are losing in aggregate → more pressure to exit → bearish atmosphere
One question is enough:
Is price above or below VWAP?
Below VWAP, every rebound may become a bull trap. Above VWAP, every decline may be a pullback.
That question filters at least 80% of my counter-trend impulses.
Use 3: the magnet effect
When price moves far from VWAP, tension develops—a stretched rubber band tending to recoil.
Many sudden rallies and selloffs are not direct reactions to good or bad news. They are forms of mean reversion after price has traveled too far from VWAP.
Why Support or Pressure Appears Near VWAP
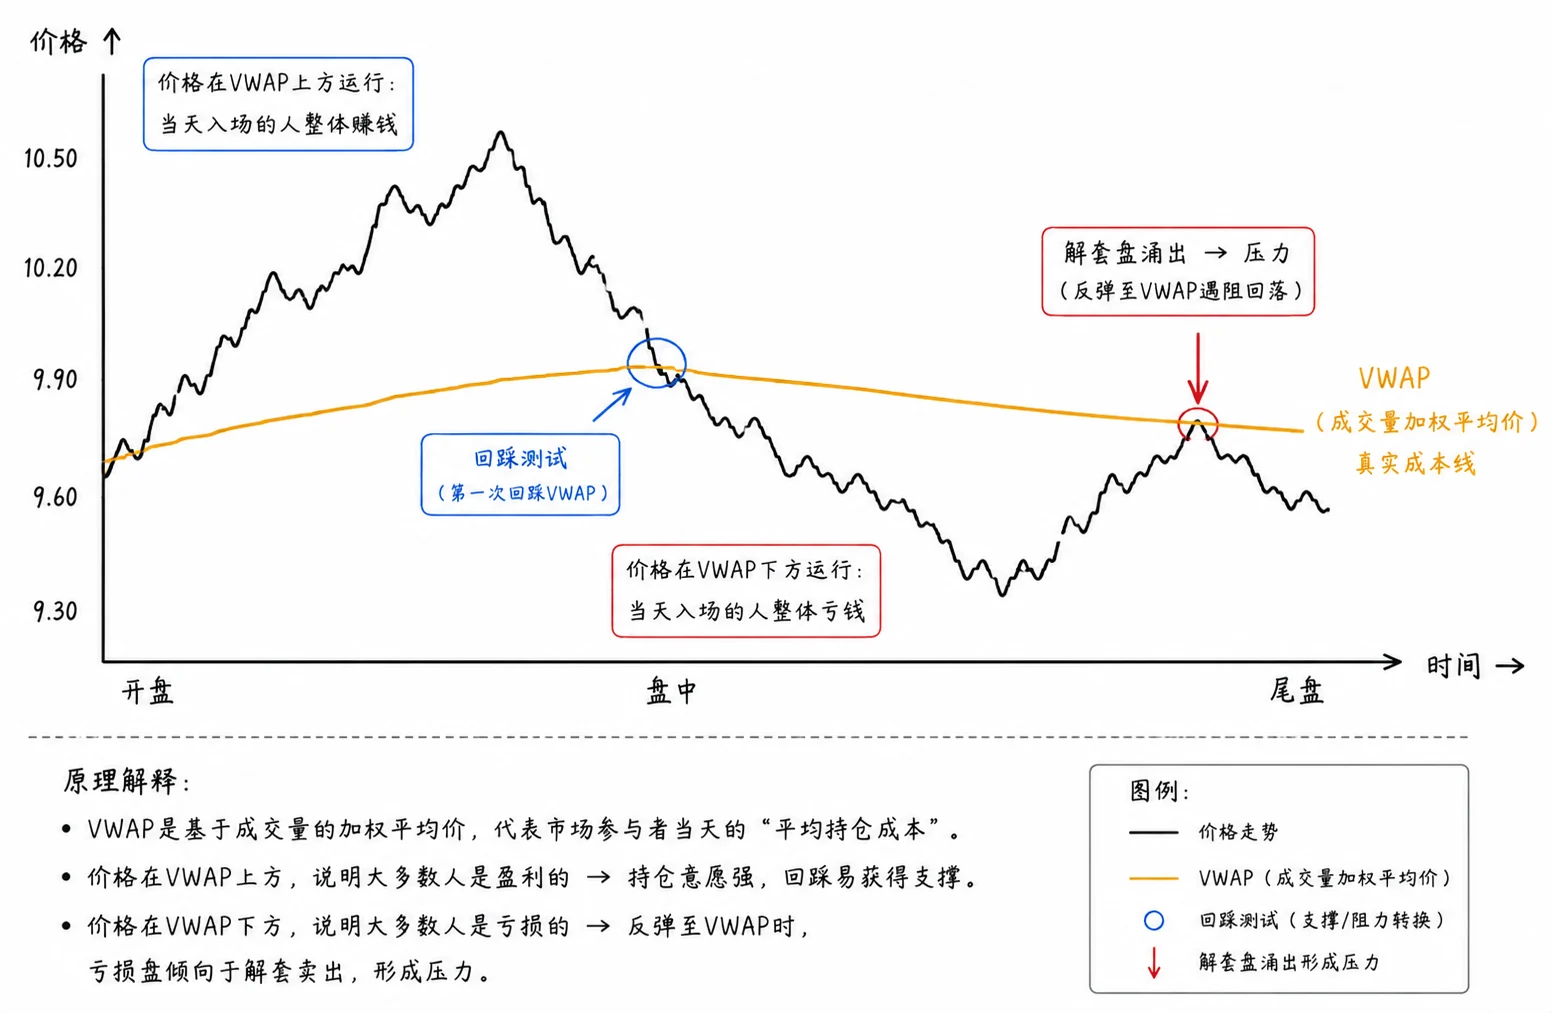
This is the part of VWAP that still gives me a chill.
Support and pressure near VWAP are not created by one dominant player. They are the combined consequence of thousands of real cost bases.
Imagine price falling from above VWAP and crossing below it.
Everyone who bought above VWAP that day is now holding an unrealized loss.
If price rebounds toward VWAP, the first instinct is often not “hold for a large rally,” but:
Finally—it came back. Let me exit with a smaller loss, or get out at breakeven.
No one coordinates that selling. It is the instinctive response of thousands of people to a losing position. That is how pressure accumulates around VWAP.
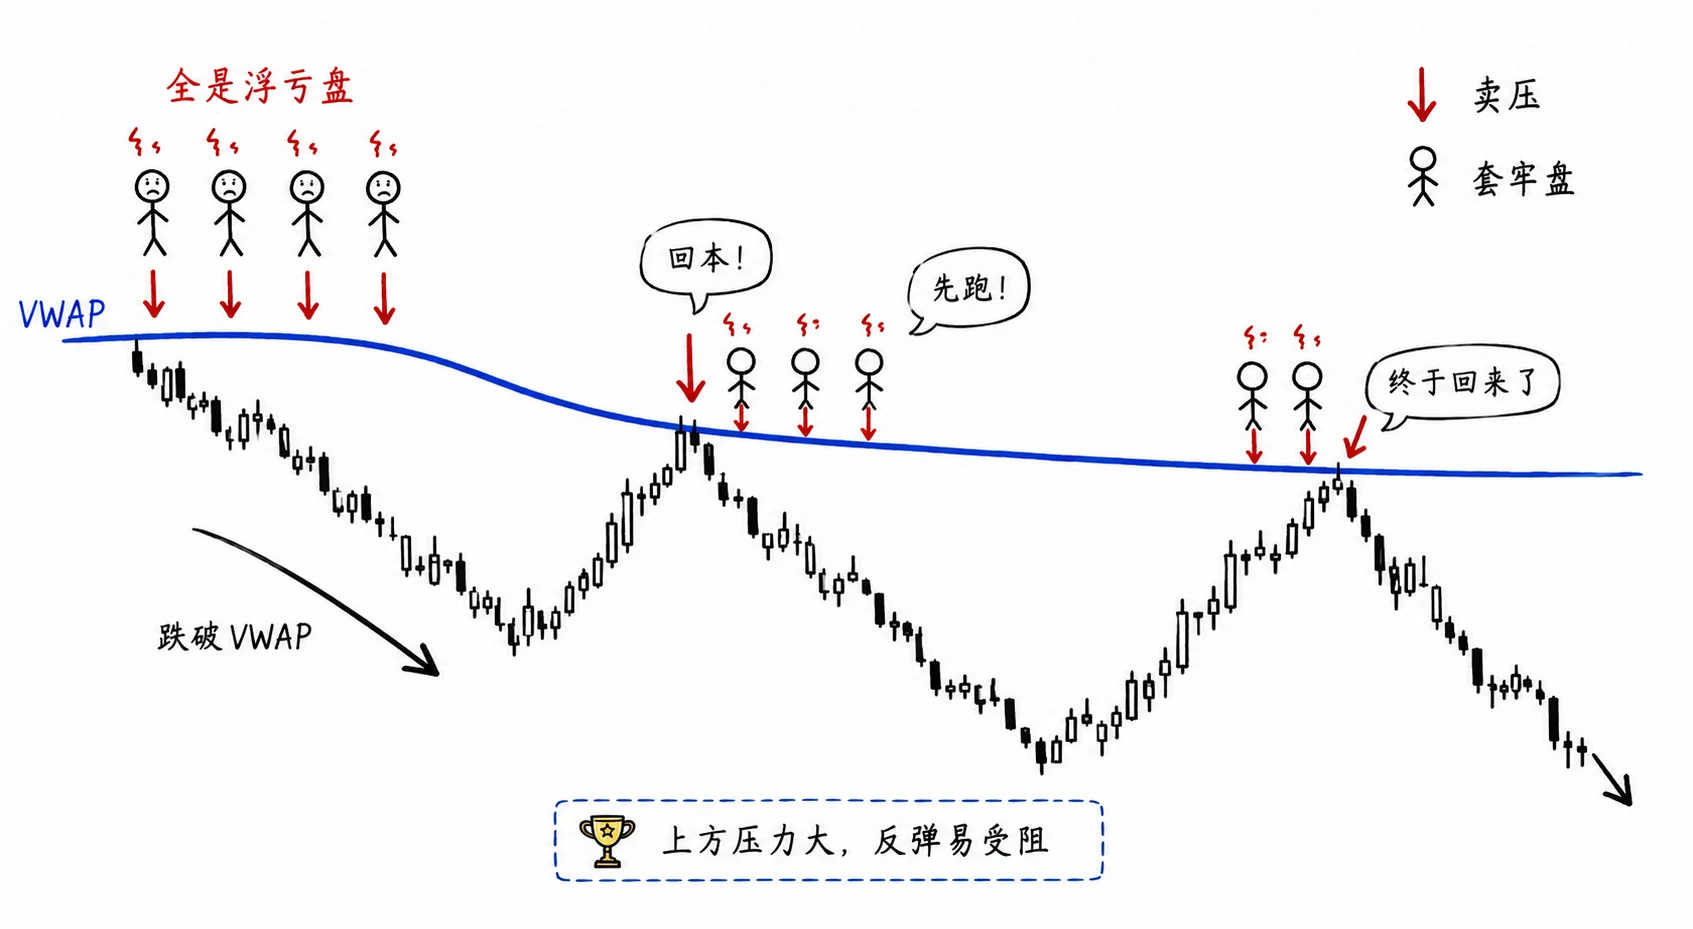
In the figure, price rebounds from below the thick blue VWAP line and meets selling each time it reaches the cost basis. The small figures are not “the house shorting.” They represent losing holders exiting near breakeven. After the market falls below VWAP, today's participants are losing in aggregate. When price returns to VWAP, the impulse is to sell first. The first test fails, and the second meets the same response. The collective desire of trapped positions to escape creates pressure at VWAP.
The inverse is also true. If price rises from below and reclaims VWAP, short positions entered underneath begin losing. Their covering demand can push price higher.
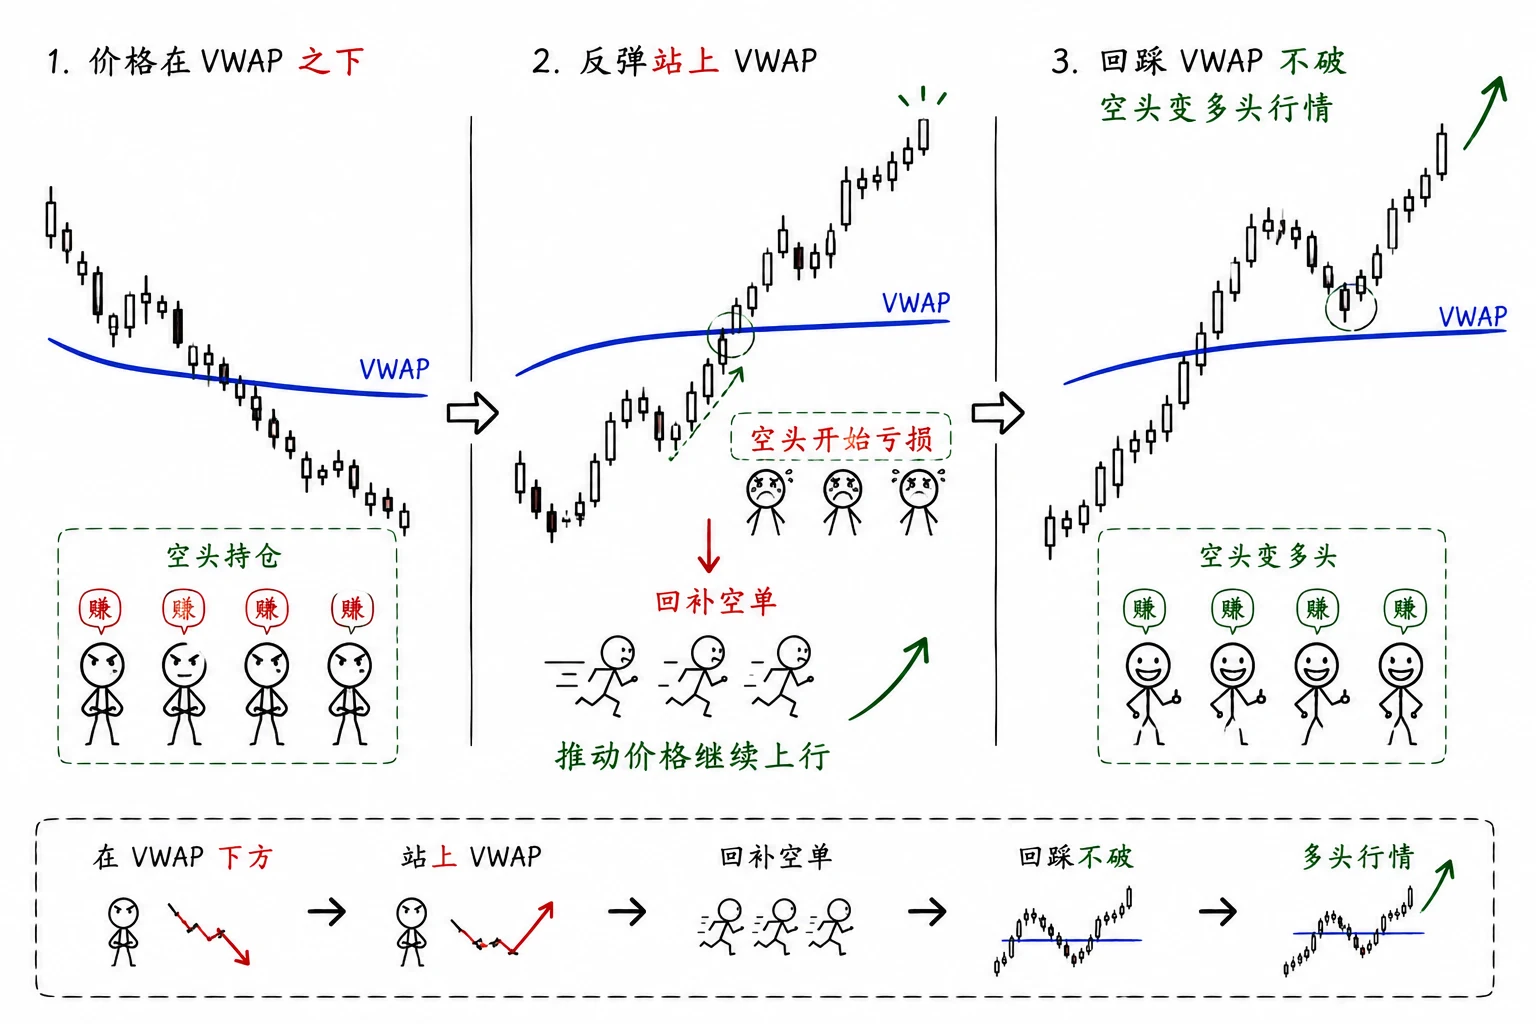
This is VWAP's self-reinforcement: the more participants respect it, the more consequential it becomes.
How I Use It
I do not use VWAP as a “signal.” I use it to filter impulses.
Use 1: before every order, ask one question
Is price above or below VWAP?
- Want to go long while price is below VWAP → wait one more beat, at least until price reclaims VWAP
- Want to go short while price is above VWAP → apply the same restraint
Use 2: false breaks around VWAP are worth watching
Price breaks below VWAP, struggles, then recovers and holds above it.
This sequence—break → reclaim → hold—can be more than a simple rebound. It may show that shorts have just been swept in a liquidity sweep; see the glossary.
Stop Run: the sweep below a round number
On January 23, reviewed in Chapter 8, SPX tested 6900 three times but reached a low of 6895—not 6900 and not 6898.
The earlier version of me would place a buy at 6900 and a stop at 6898 or 6899, believing the round number was safe. The wick would take me out.
A round number such as 6900 is often a cluster of stop orders, not the strongest structural support. Price can be pushed through the number, triggering sell stops, while buyers take the other side five or ten points below. This is a stop run, one form of liquidity sweep.
The February 13 sweep occurred at 6795, below the 6800 Put Wall. January 23 reached 6895, below the psychological 6900 level. The pattern was similar, but the battlefield differed—one was a GEX Put Wall, the other a round-number level.
Other dimensions must confirm a reversal. VWAP alone, or a round number alone, is not enough for me.
Use 3: VWAP + options walls = two forms of confirmation
VWAP is the day's cost-basis divide. Options walls and the Gamma Flip are its structural divide.
- When both point in the same direction, I become willing to consider the trade
- When they conflict, I reduce size or do not trade
When VWAP Misleads
- Extreme event days, such as CPI or FOMC—rapid repricing can reduce its usefulness
- Narrow range days—VWAP becomes nearly flat and price crosses it repeatedly
- Large opening gaps—VWAP is less meaningful during the first 30 minutes
In those conditions, I rely less on VWAP and more on current GEX structure and key levels.
Every tool has a domain where it fails. Knowing that domain matters more than the tool itself.
VWAP is not merely a moving average or a fixed support/resistance line. It is the volume-weighted cost basis of the day's participants—the real emotion of thousands of profitable and losing positions around one line. You can dismiss a technical indicator; it is harder to dismiss the combined behavior of real capital.
VWAP remains essential to me. But it took a long time to accept one fact:
VWAP is not a signal. It is a filter.
I used to chase a long when price crossed above VWAP and chase a short below it. False breaks repeatedly cut me up. Eventually I understood that VWAP does not tell me what to do now. It tells me who is making money and who is losing.
Knowing who is losing is often more useful than knowing where price is.
People in loss try to stop losing. Their actions create the pressure and support around VWAP.
Price Action: What Are the Candles Saying?
Candles are the market's most direct language. Here, I use only the parts related to trend: breakout or reclaim, strength of momentum, and movement toward structural levels. This is not an encyclopedia of patterns or an indicator package. Price action describes what has happened, not what must happen next.
The scope matters. Price action includes trends, where traders follow direction and momentum, and ranges, where traders buy low and sell high inside a box. Range trading in SPX often pairs better with short-premium structures such as iron condors and iron butterflies, where time decay and immobility are the edge. This is the Buyer Edition, limited to Long Calls and Long Puts, so I discuss only trend-oriented readings. Range trading is not wrong; it is simply outside this book's scope.
Intraday, I watch three things:
- Breakout or reclaim: does price break a wall and immediately return, or hold the break and continue? That separates February 13 from February 17
- Momentum: is the rebound short-lived or supported? Which side advances with rhythm? I read the strength and follow-through of recent candles, not a moving-average crossover
- Location: is price near the Call Wall, Put Wall, Gamma Flip, or VWAP—or wandering in the middle?
Only then do I decide whether the day has direction or is trapped in a range. If direction exists, I combine price action with GEX and VWAP. If price is ranging, two rules govern my trend-based approach:
Candles alone can make strength look convincing just before it hits a wall. Add GEX and VWAP to ask whether that strength is genuine.
Do not reach in the middle. When price wanders between structural levels, I do nothing by default. I wait until it reaches a wall, Flip, or VWAP before considering action.
Avoid Cheap Consensus: Combining Traditional Indicators with GEX
One statement makes many traders uncomfortable:
A technical indicator often loses effectiveness not because the market changed, but because too many people use it the same way.
EMA20, oversold RSI, MACD crossovers, and Bollinger Bands may work while used quietly. When every retail trader watches the same EMA20, liquidity and stops concentrate around it. False breaks and reversals naturally occur there. Consensus itself becomes material the market can consume.
That is not a conspiracy theory. It follows from market microstructure. Liquidity clusters around prices everyone calls important—and so do stops and breakout orders.
What I Use Instead of EMA20
I do not discard moving averages entirely. I add another dimension.
Alternative 1: VWAP as the cost benchmark. VWAP represents today's volume-weighted cost and is harder for any one participant to target than an EMA20.
Alternative 2: wait after a break. Instead of chasing the first move, wait for a reclaim and subsequent hold to distinguish a genuine break from a liquidity sweep.
Alternative 3: GEX as a dimension outside visible consensus. EMA20 reflects a broadly visible technical consensus. GEX maps market-maker hedging pressure. When GEX and price action point the same way, two different logics reach one conclusion.
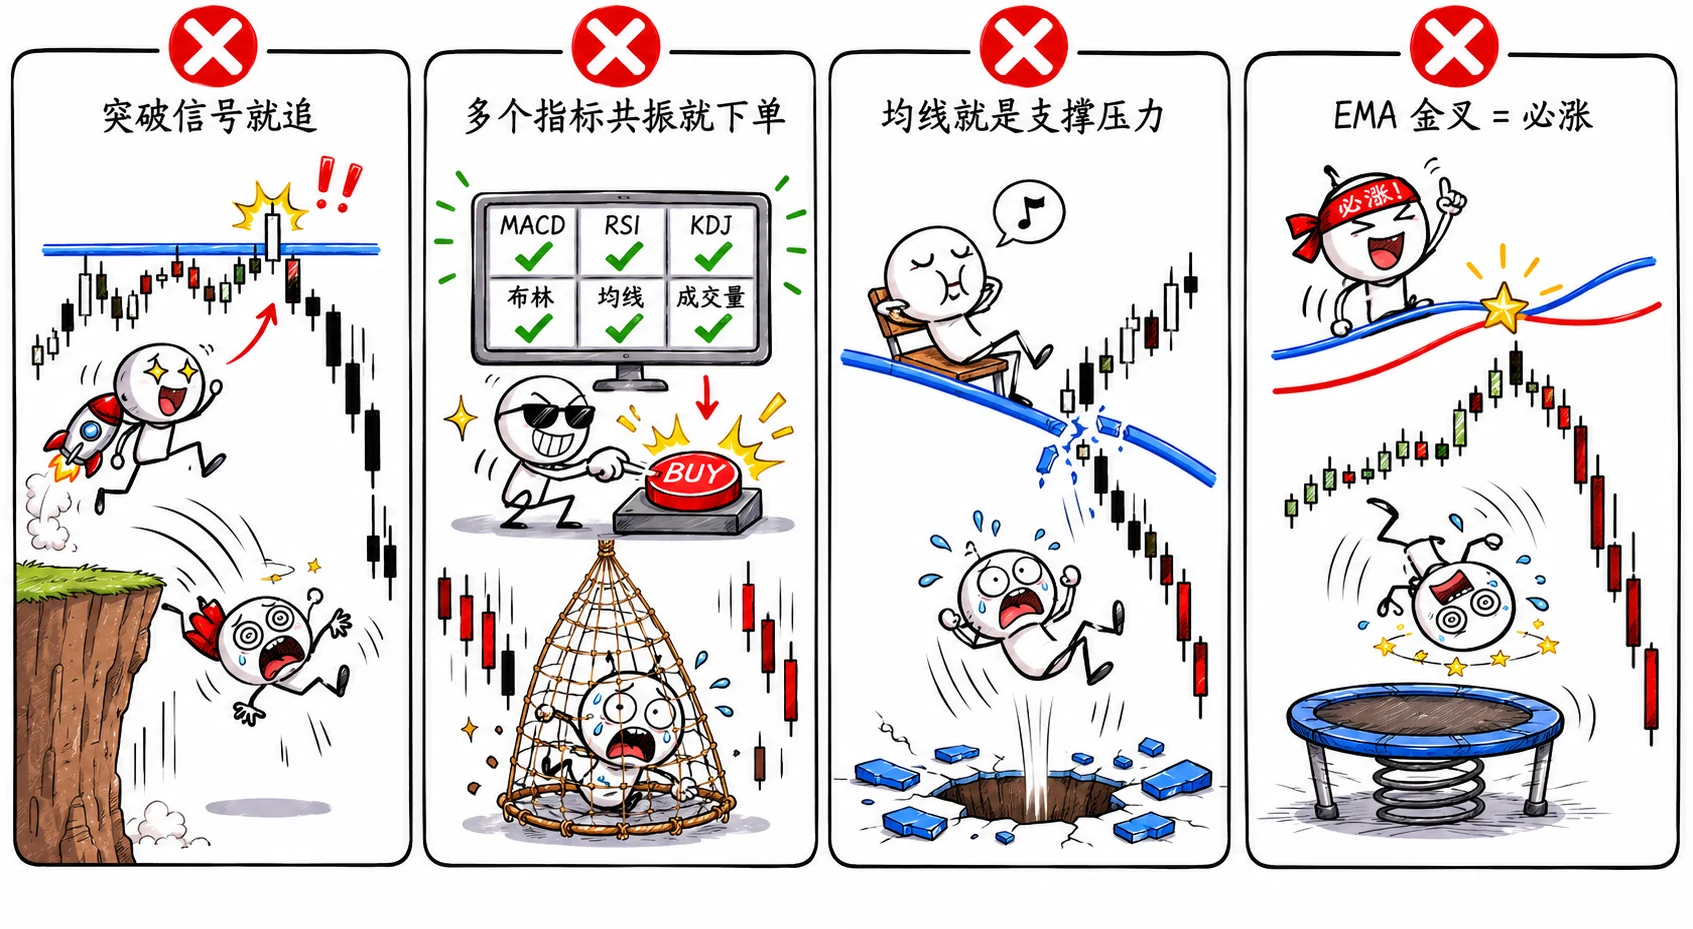
After years of watching charts, I accepted that indicators rarely deceived me; I often misheard them. The four panels still describe me from time to time. A breakout appears and the brain relaxes—finally, direction—so I want to chase. Several indicators light up together, giving the trade an official stamp; not acting creates anxiety. A moving average looks like a floor that “should hold.” An EMA crossover flashes and the body moves before the mind—correlation has become causation.
The central lesson of trading-psychology books became real only through my own slippage: every trade is a probability, not a verdict. Breakouts, crossovers, and confluence are visible to everyone. Consensus is not evil. The danger is treating it as the only truth and forgetting to ask: Does GEX agree? Is VWAP on the same side?
An EMA records prices that have already traded. GEX describes hedging pressure in the options chain that may not yet be fully released. They are two ledgers. If visible consensus points higher while the Call Wall sits overhead and is thinning, the lesson is not “the indicator is wrong.” It is that I am using visible history to bet on invisible remaining capacity. When both ledgers agree, I raise the volume. When only one speaks, I assume the trade has not yet earned the right to be placed. A single signal buys comfort, not odds.
| ❌ Misreading | ✅ Better interpretation |
|---|---|
| Chase as soon as a breakout appears | Wait for acceptance or reclaim after the break |
| Trade whenever several indicators agree | Add GEX structural support as another basis |
| A moving average is support or resistance | It is a consensus cluster visible to everyone |
| EMA crossover means price must rise | The more crowded the consensus, the greater the danger |
The cheaper the consensus, the greater the danger. I prefer VWAP to an EMA, confirmation after a break to chasing, and GEX structure to a pile of correlated indicators—not because they are infallible, but because they are less easily reduced to one crowded trigger.
Bollinger Bands: From Weak Alone to Useful with a GEX Filter
I began, like many traders, with traditional indicators such as Bollinger Bands. Used alone, they are often too weak for minute-by-minute 0DTE—not because the indicator is wrong, but because it answers a different question and usually lags. By the time the signal forms, much of the move may be over.
Remember what Bollinger Bands represent. They are not fixed support and resistance. They describe a probability range around price under current volatility—a rubber band that expands and contracts. Price spends much of its time within the bands; the upper band is relatively expensive, the lower relatively cheap, and a squeeze can precede expansion. The bands tell you whether price is stretched, not whether today's structure supports a reversal or acceleration.
Their real value appears when they are combined with GEX:
| Bollinger position | GEX state | Reading |
|---|---|---|
| Touching lower band | Positive GEX | Higher-probability rebound area: lower band + damping structure |
| Touching lower band | Negative GEX | Do not buy the dip: paper-thin support; the lower band may be only a pause |
| Near middle band | Positive GEX | Range regime; do not chase either side |
| Band squeeze + fresh break of Gamma Flip | Negative GEX | Volatility expansion; an established direction can accelerate |
Bollinger Bands alone tell you “relatively expensive or cheap.” GEX tells you whether the day's structure is more likely to support a rebound or acceleration.
Bollinger Bands ask whether price is stretched. GEX asks what kind of market this is. The first becomes more useful when filtered by the second.
GEX does not replace Bollinger Bands or moving averages. It adds a structural filter.
GVP: Structure, Cost, and Price Action
After trading 0DTE for this long, I noticed something:
Most losing trades did not begin with a completely wrong direction.
They began with a direction that was only half-right. Structure suggested long while the cost line argued short. GEX said the market could move, but price action had not confirmed it. I traded inside that disagreement and suffered.
Eventually I made a rule:
I raise the priority of acting only when GEX, VWAP, and price action point in the same direction.
GVP is not a scientific law, formula, or recommendation. It is my personal experience-based filter. It is not a holy grail and cannot guarantee profit. Its job is to remove trades that feel attractive while their internal logic conflicts.
Three Dimensions, One Job Each
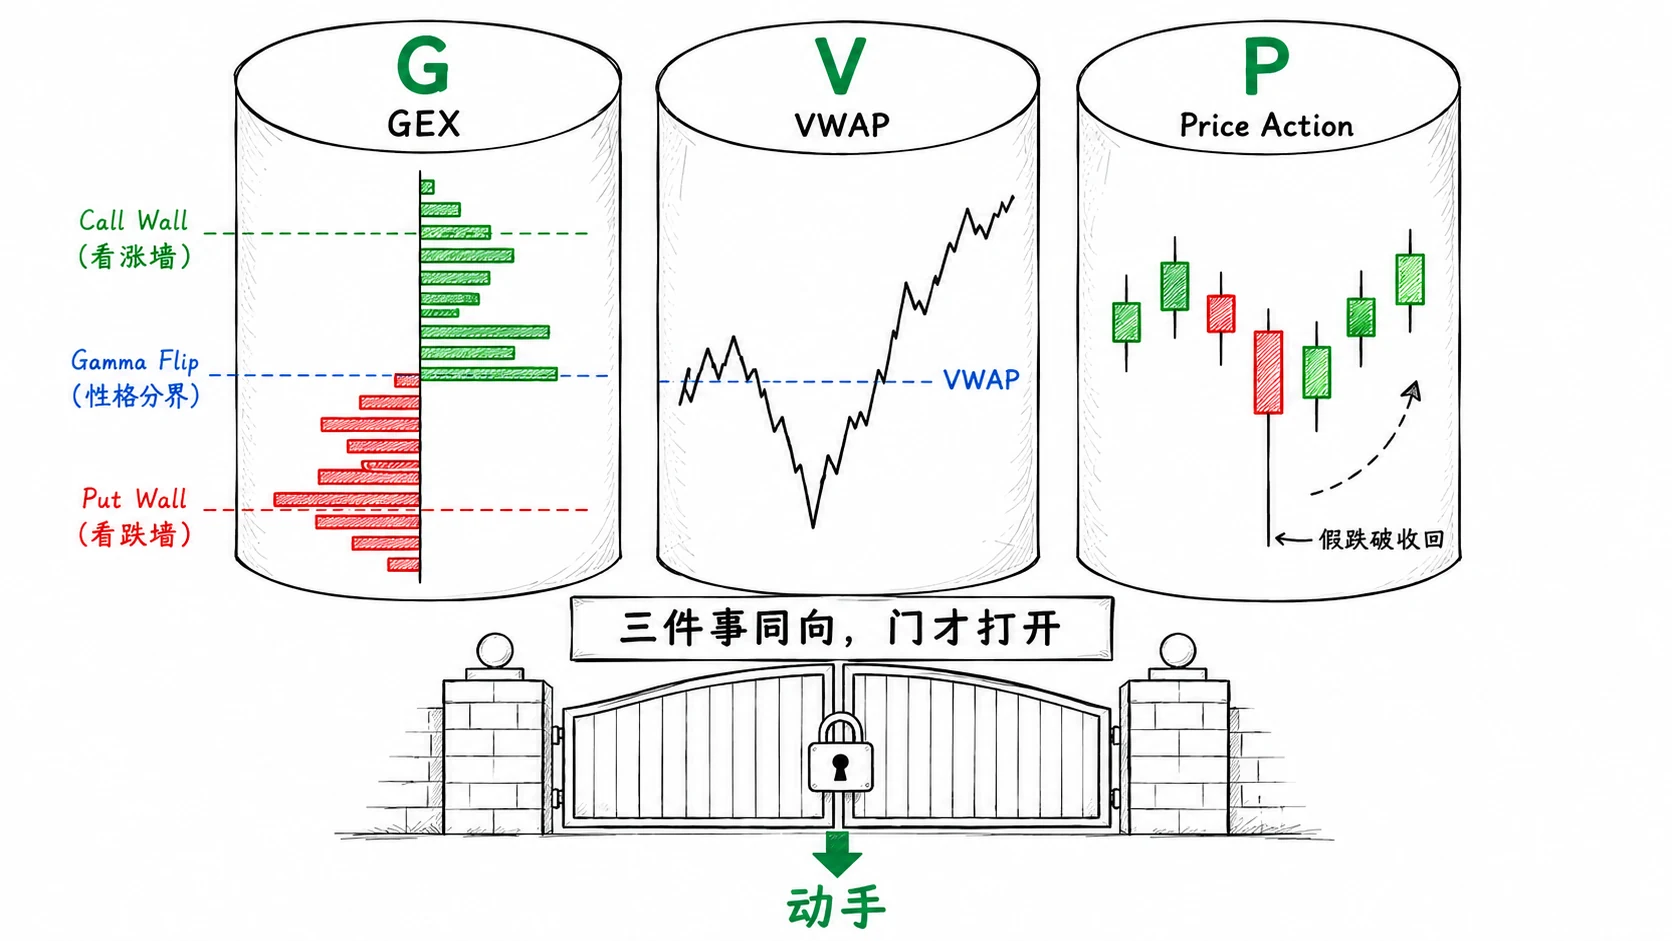
GEX covers structure—damping or acceleration, and wall location. VWAP covers cost—who is winning and losing. Price action covers the tape—break or reclaim, momentum, and proximity to structure. Each answers one question; together they make a map.
Any one dimension by itself is incomplete:
- GEX alone: you know structure, not cost. The market may sit above the Put Wall in positive Gamma, but VWAP can remain overhead while all intraday longs are losing. Buying a Call in that supposedly favorable GEX environment can be painful.
- VWAP alone: you know cost, not structure. Price may rise above VWAP while remaining in a negative-Gamma region where market makers hedge pro-cyclically. The bullish atmosphere above VWAP may be only a pause after a large gap, not stable demand.
- Price action alone: you do not know where the ceiling is. The candles may look strong, but a Call Wall ten points above can already be accumulating selling pressure. Chasing into it hurts.
What Does GVP Alignment Look Like?
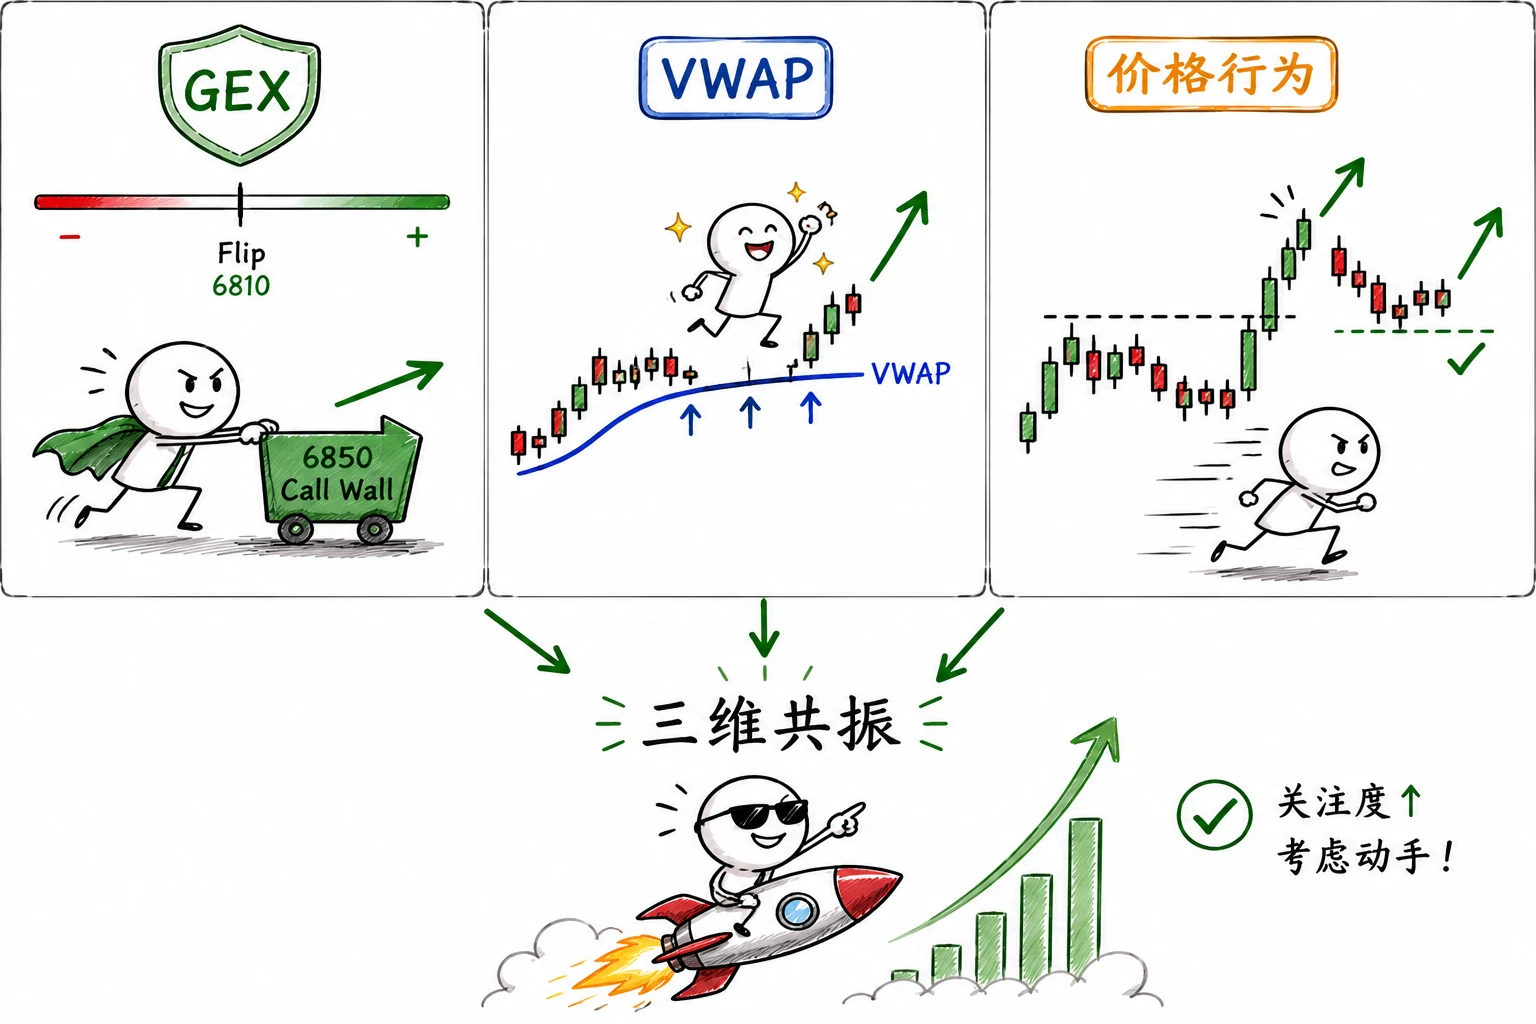
Read the figure as a long setup like February 17, where structure, cost, and price action aligned upward.
Take the long-side confluence on February 17 as one example—not a template every trade must match.
GEX: price crossed the Gamma Flip into positive Gamma and advanced toward the Call Wall. Structure moved from “do not catch the knife” to an advance on the shock-absorber side; market-maker hedging became counter-trend, damping rather than fueling the move.
VWAP: price reclaimed the cost line. VWAP changed from overhead pressure to support. The day's participants moved from loss toward profit; less trapped supply remained and buying became steadier.
Price action: the breakout held, the pullback did not fail, and momentum remained with buyers. This was not a moving-average crossover; the candles themselves were speaking.
Each answered one question. When all pointed the same way, I did not conclude that price “must rise.” I concluded that fewer objections remained. Price, capital, and structure told the same story, so the trade earned serious attention.
February 17 produced one of my quietest entries—not because it felt good, but because the three dimensions were not arguing.
The move from 6810 to 6849.56 was relatively clean. I did not know how far it would travel. I knew only that the structure presented no obvious objection.
Short-side confluence: March 18
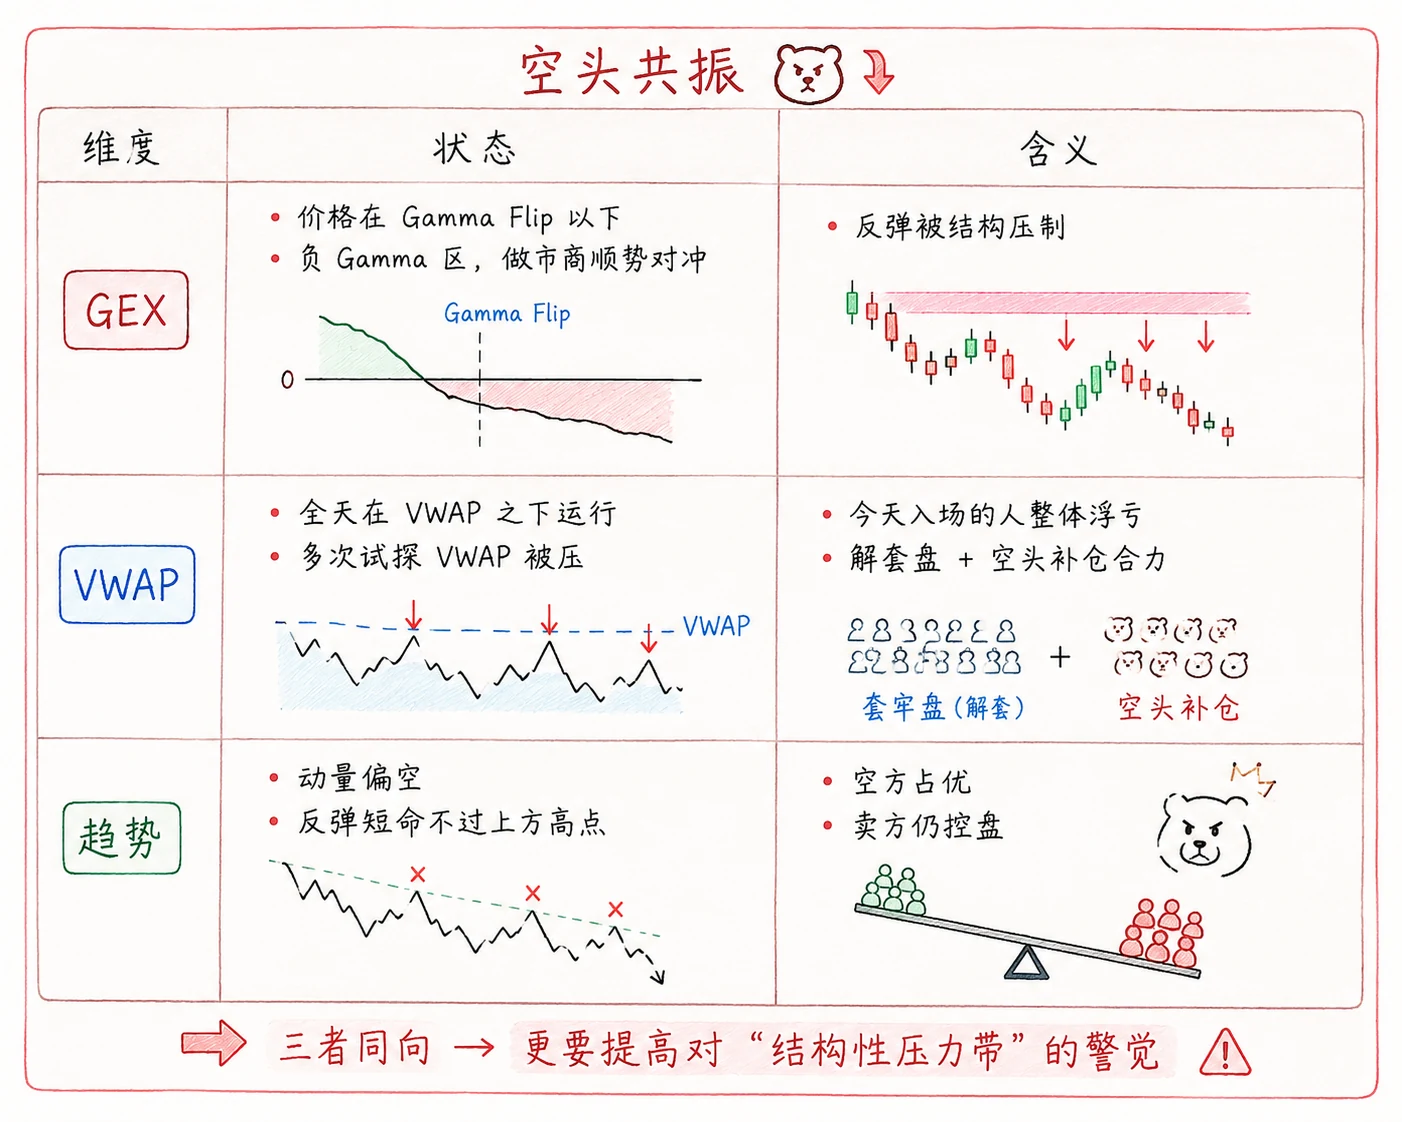
Imagine price trapped beneath a sheet of glass. GEX provides structural pressure above: price is below the Gamma Flip, and every rebound is pushed back. VWAP is another cost line overhead. Participants below it are losing; each test meets selling from traders seeking breakeven and shorts adding into the rebound. Price action does not collapse, but it cannot lift its head—rebounds are short-lived and highs keep falling.
Trapped longs wait to escape. Shorts wait to sell the bounce. Together they weaken each recovery. No single indicator is sounding an alarm. Structure, cost, and the tape are all saying, “Do not catch this casually.”
The March 18 logic was not “I predict a decline.” It was that all three dimensions said the same thing, and I chose to listen.
What If GVP Conflicts?
My choice is simple: do nothing, or observe with a very small position.
- Two dimensions conflict → no new position by default
- Two agree and one conflicts → I may watch, but size is very small
- All three are unclear → the day may not be suitable for me
“You can choose not to trade” is the most important rule in GVP.
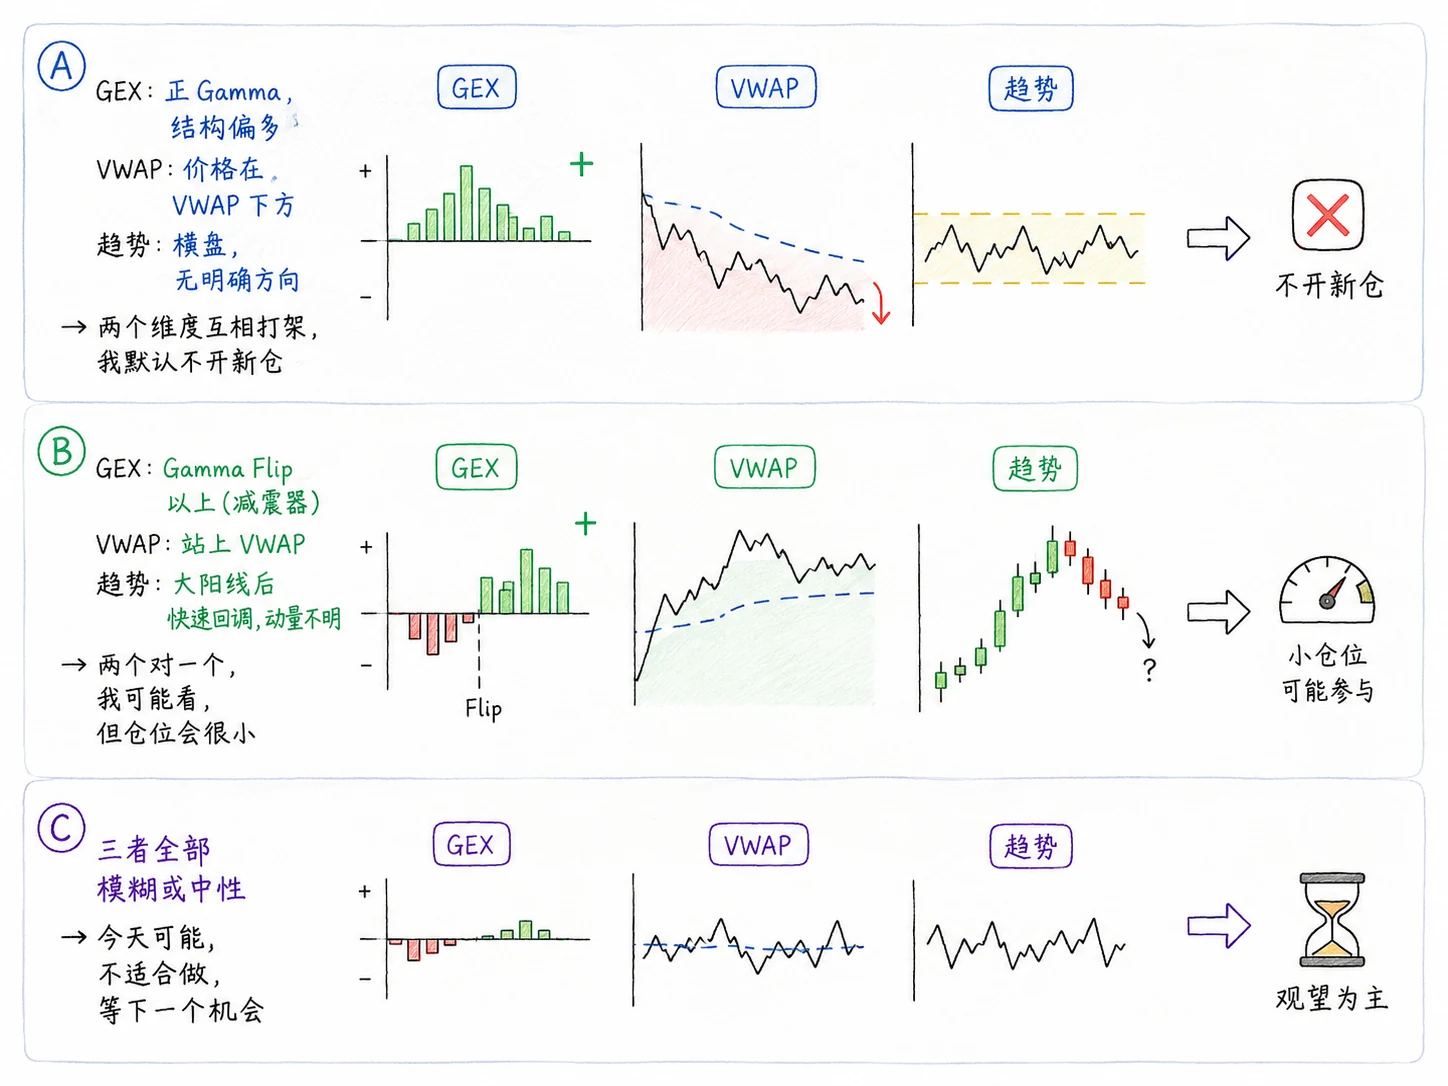
A · No position. Structure is in positive Gamma and should be stable, but price remains below VWAP and candles grind in the middle without direction. GEX says “stable”; cost and price action say “not yet.” I open nothing. It feels like one person pulling your sleeve and another pulling your leg: every step is awkward.
B · Small position. Price reclaims VWAP, momentum begins to appear, and GEX sits above the Flip with a mild bullish structural bias. Confluence seems to be forming, but volatility remains fast and the trend is not established. I place it on the watchlist and use, at most, a small position. In fog, a road sign may be visible while the hole a few steps ahead is not.
C · Observe. GEX hovers near zero, price crosses VWAP repeatedly, and the trend has not woken up. All of GVP is neutral. Noise is greatest and emotion is easiest to provoke. Longs are wrong, shorts are wrong; waiting in cash is cleaner. It is like three radios playing at once—none can be heard clearly.
GVP filters out bad days as much as it finds opportunities. When the dimensions conflict, the best answer is often no trade. That sentence is worth more than an entry signal.
Running the Filter Through a Full Day
GVP is applied in time order, not as nine indicators thrown at the screen at once.
It confirms the market's character after the open. Premarket GEX is only a draft; VWAP does not exist before the open; price action must develop. False signals concentrate in the first minutes as overnight hedges, ETF rebalancing, liquidity sweeps, residual news, and high-frequency competition rebuild the book. I therefore make scenarios before the open, not conclusions.
This continues the chapter's premarket process: mark the calendar, GEX, and map to frame possibilities. After 9:30, VWAP forms and price action develops. Only after GEX, VWAP, and the tape stabilize do I ask whether to act.
Plan before the open; wait for confirmation afterward. Refusing to prove yourself in the first 30 minutes avoids many false signals.
Before 9:30—create scenarios, not conclusions
- Calendar: is this an event day? Raise the threshold and control size
- GEX: mark Call Wall, Put Wall, and Gamma Flip; where is spot relative to them?
- Map: add prior high and low plus event times; frame a possible range or trend without choosing direction
After the open—observe for 15–30 minutes, then confirm
The market digests overnight information and rebuilds liquidity. I generally observe without committing heavily. Has a GEX wall been swept? Which side of VWAP is price on once the line forms? Did the first structural candle break or reclaim? After the noise settles:
- VWAP: is the cost line helping or blocking the trade?
- Price action: breakout or reclaim? Who controls momentum? Is price near a wall, Flip, or VWAP?
- GVP comparison: are all three aligned, or is this one of the conflicting A/B/C cases?
Threshold for action
- GVP aligned → consider entry; alignment remains a filter, not a guarantee
- Two aligned, one conflicting → reduce size or observe
- Two or more conflicting → do nothing and wait for another structure
Common false GVP: GEX and price action align, but VWAP has only just broken and does not hold—allow 5–15 minutes of proof. All three align at the open, but intraday GEX later changes—refresh near key levels. All three appear bearish after an already extreme decline and the book is thin—a deep V may be close. One of the most dangerous shorts comes after a deep decline when GVP appears to confirm what has already happened.
| ❌ Misuse | ✅ Better interpretation |
|---|---|
| GVP guarantees profit | GVP is a filter that improves selectivity |
| Two dimensions are enough | The third dimension often contains the decisive disagreement |
| GEX is primary and the others are secondary | All three have equal weight; one cannot substitute for another |
| Full size whenever GVP aligns | Alignment provides an entry rationale; sizing is a separate system |
| Opening alignment lasts all day | In 0DTE, GVP can change intraday |
| Use intuition to resolve conflict | When dimensions conflict, do nothing |
GVP is not “three indicators turn green, so buy.” GEX describes structure, VWAP describes cost, and price action confirms the tape. I raise attention when all three point the same way. More importantly, refusing to act when they conflict is the filter's greatest value.
You do not need to understand every move. Act when all three dimensions support you, and remain still when they speak different languages. The second skill is often harder.
I rewrote that sentence three times before putting it in the book. I paid a great deal of tuition before “remain still” became real.
I once believed that a trading day without a position was wasted time. Eventually I accepted that cash is not inactivity. It is an active judgment that this day does not belong to my system. Markets offer opportunities every day, but most do not belong to you. Forcing yourself into them is the real waste.
Choosing a Contract and Placing the Order
The preceding sections explained what to read. This one addresses what to select and how to execute.
One easily skipped question stands between analysis and order entry:
If the view is bullish, which contract should I buy?
A 6800 Call or 6810 Call? Expiring today or tomorrow? Delta 0.4 or 0.6?
Every strike and Delta comparison below is illustrative.
These are not small questions. The same directional view can become unrealized profit when expressed through the wrong contract.
The Triangle: Strike, Delta, and Cost
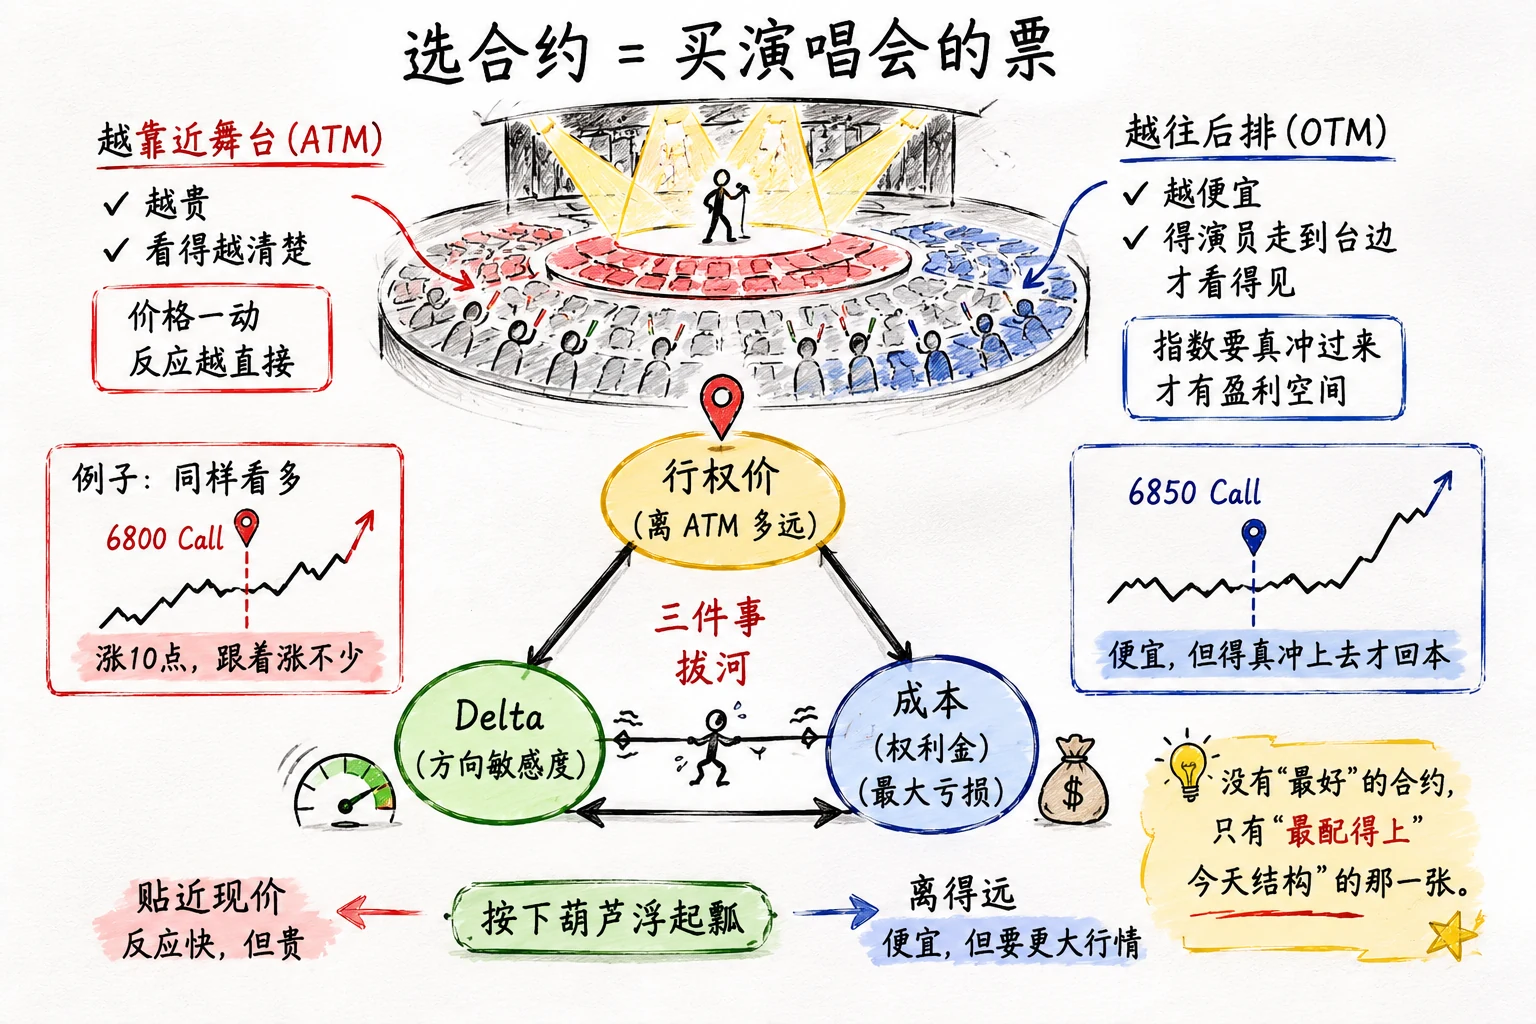
Choosing an option resembles buying a concert ticket. The closer you sit to the stage—ATM—the more you pay, but the more directly you experience every movement. A seat farther back—OTM—is cheaper, but the performer must come much closer before you can see.
If you buy a 6800 Call near spot and the index rises ten points, the option responds meaningfully. A distant 6850 Call saves premium, but SPX must travel much farther before the trade pays. Cheapness has a cost.
0DTE contract selection is a tug-of-war among strike distance, Delta, and premium. Move one and the others respond. Near spot means responsive but expensive; farther away means cheap but dependent on a larger move. No contract is universally best. The question is which contract matches today's structure.
Strike and Delta
How I choose a strike. I do not seek the cheapest option. OTM lottery tickets have low Delta, severe relative Theta, and weaker liquidity.
My preference changes with the day's character:
- Positive-Gamma range day → slightly ATM, Delta around 0.4–0.5
- Negative-Gamma trend day → ATM or slightly ITM, Delta around 0.5–0.6
- Entry after trend confirmation → ATM; event day → closer to ATM
One thing I do not do: buy a Call above the Call Wall. The February 17 stall at 6850 is the lesson.
I also prefer round-number SPX strikes—not because round numbers predict better, but because liquidity is often deeper and transaction cost lower.
Delta is an intuitive guide, not an exact forecast.
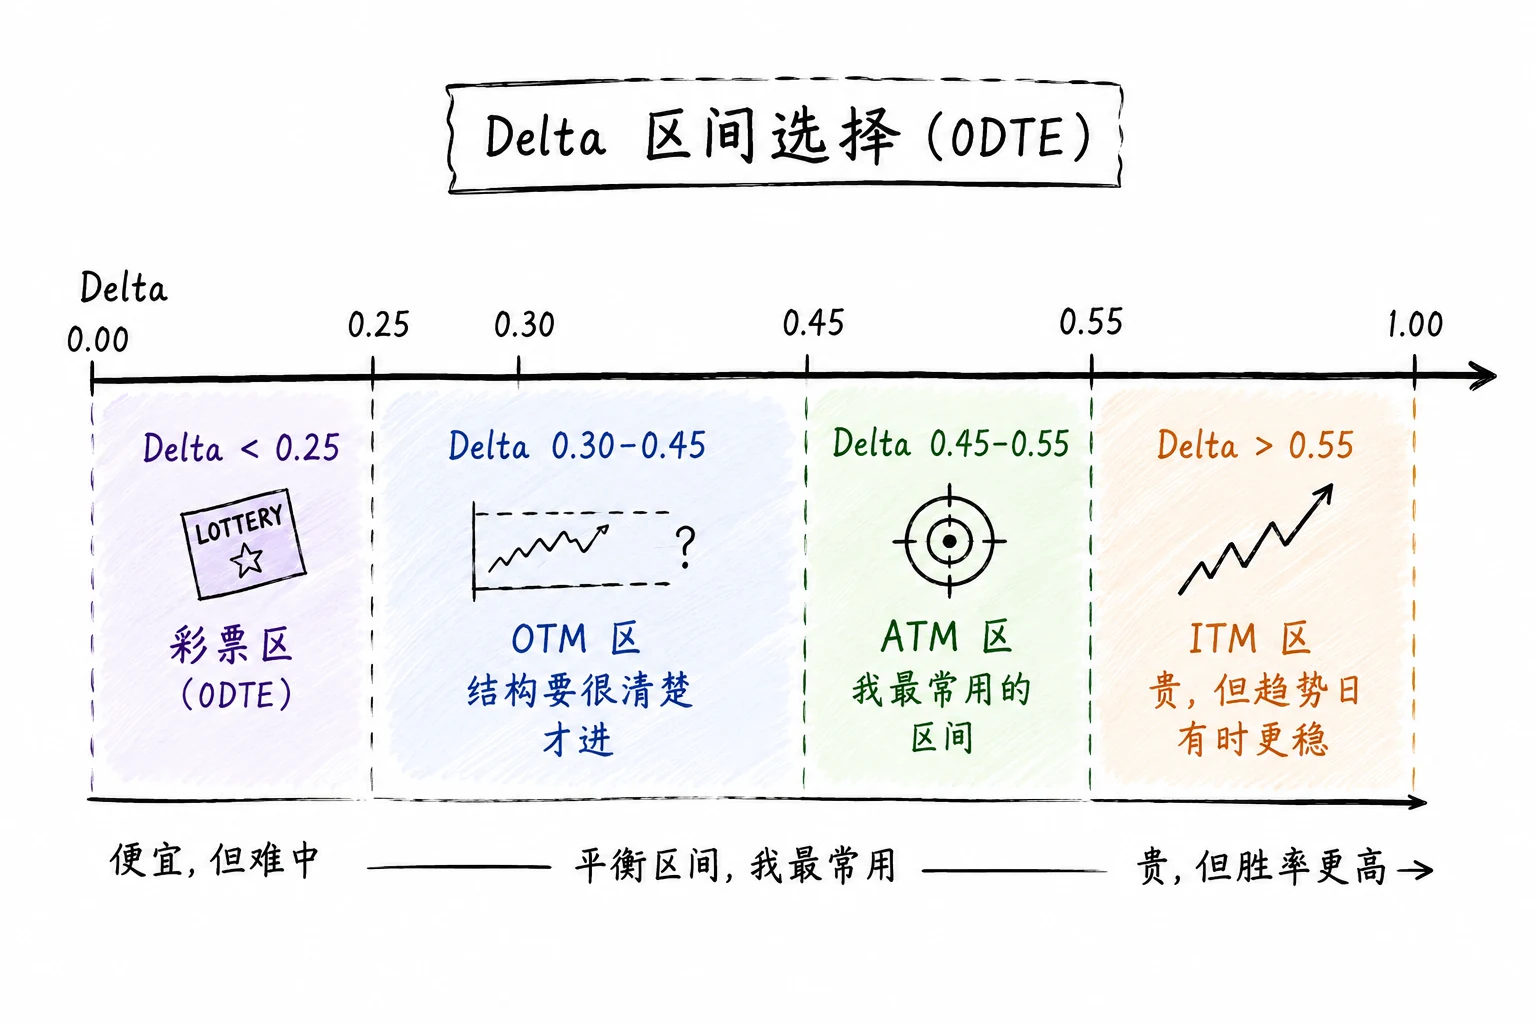
Delta helps with two questions:
1. Directional sensitivity
- Delta 0.5: a 10-point SPX move changes the option by roughly $500, using the $100 multiplier
- Delta 0.3: the same move changes it by roughly $300
“How far must SPX move to cover my cost?” Delta helps frame that question.
2. How stock-like is the option?
Higher Delta makes an option behave more like the underlying.
As a 0DTE buyer, I do not seek extremely high Delta, such as above 0.8. The cost approaches a direct directional position while Theta remains. In that case, ES futures may be more efficient.
Expiration, Execution, and Process
Expiration-specific rules. I avoid opening a new long-premium 0DTE position during three windows: the first five minutes after the open, the 30 minutes before an important release, and after 15:30, when Pin, Charm, and Theta overlap.
The principle for a 0DTE buyer is simple: do not wait for 16:00. Profit is realized by exiting, not by enduring until the final second.
Execution habits. I use a limit order 99% of the time, usually near the middle of the bid-ask spread and slightly toward the ask. If it does not fill, I do not chase.
I divide size into two stages: a test position, usually 40–50%, then a confirmation add. I pay a small cost if the structure fails; I add only after the trade begins to confirm.
Before clicking, I answer one question: If the direction is wrong, where will I admit it? I do not wait until the loss becomes overwhelming to invent an answer.
Full Trading-Day Checklist
The process below runs from scenario to exit. Complete one step before the next. It is a standard operating procedure, not an invitation to trade whenever inspiration appears.
Structure before direction; risk before profit.
0. Premarket scenarios, not conclusions—calendar, GEX, and map
1. Observe the first 15–30 minutes—allow overnight information and liquidity to settle; do not commit heavily
2. Check GVP—do GEX, VWAP, and price action align?
3. Decide whether the day is worth trading—no trade is an answer; stop if two or more dimensions conflict
4. Form a bullish or bearish view—direction comes from structure, not feeling
5. Define structural invalidation—which break makes the idea wrong: Flip, VWAP, or wall?
6. Set risk in dollars—maximum loss and percentage of the account; see Chapter 7
7. Choose the contract—ATM or slightly OTM, suitable Delta—often 0.35–0.55—and sufficient liquidity; prefer round strikes and do not buy at a wall
8. Enter with a limit order—place it inside the spread; do not chase
9. Test the idea—start with 40–50% and see whether price follows the structure
10. Add only after profit confirms—never average down into a losing position
11. Exit by structure—realize the profit; leave when structure fails and do not wait for 16:00
If my mental state is poor, I want to win back a loss, or the day contains a major event, fewer trades are better. The checklist filters; it does not manufacture reasons to act.
| ❌ Mistake | ✅ Better practice |
|---|---|
| A cheap option has little risk | Low price + low Delta means a larger move is required |
| Higher Delta is always better | High Delta costs more and still carries Theta |
| A market order is faster and therefore better | At a key moment, a market order gives away the spread |
| Decide the stop after entry | The stop is part of the order decision |
| Buy a Call at the Call Wall | The Call Wall is often a momentum-exhaustion zone |
| Enter full size at once | Test + confirmation add; pay a small price when wrong |
Contract selection is a triangle: nearer ATM costs more but responds faster; higher Delta behaves more like the underlying but costs more; and the 0DTE clock counts by the minute. I usually stay near ATM, prefer round strikes, and use Delta around 0.45–0.55. Limit orders, staged entry, and a predetermined stop improve execution quality.
The Intraday Landscape: How Price Moves Around Walls
We have examined the three GEX levels, VWAP, and daily character separately. Now combine them into one practical question: how does price tend to behave relative to the walls?
Do not memorize seven paths mechanically. Market reading begins with two questions:
Is the wall still valid? If it failed, did the market's character change?
Figures 5-17 through 5-19 organize seven common paths into three groups: wall valid → wall failed → character changed. They are templates, not predictions. Price can migrate among them. Recognizing the current group is more useful than guessing the next candle.
Wall Valid: Price Remains Structurally Constrained
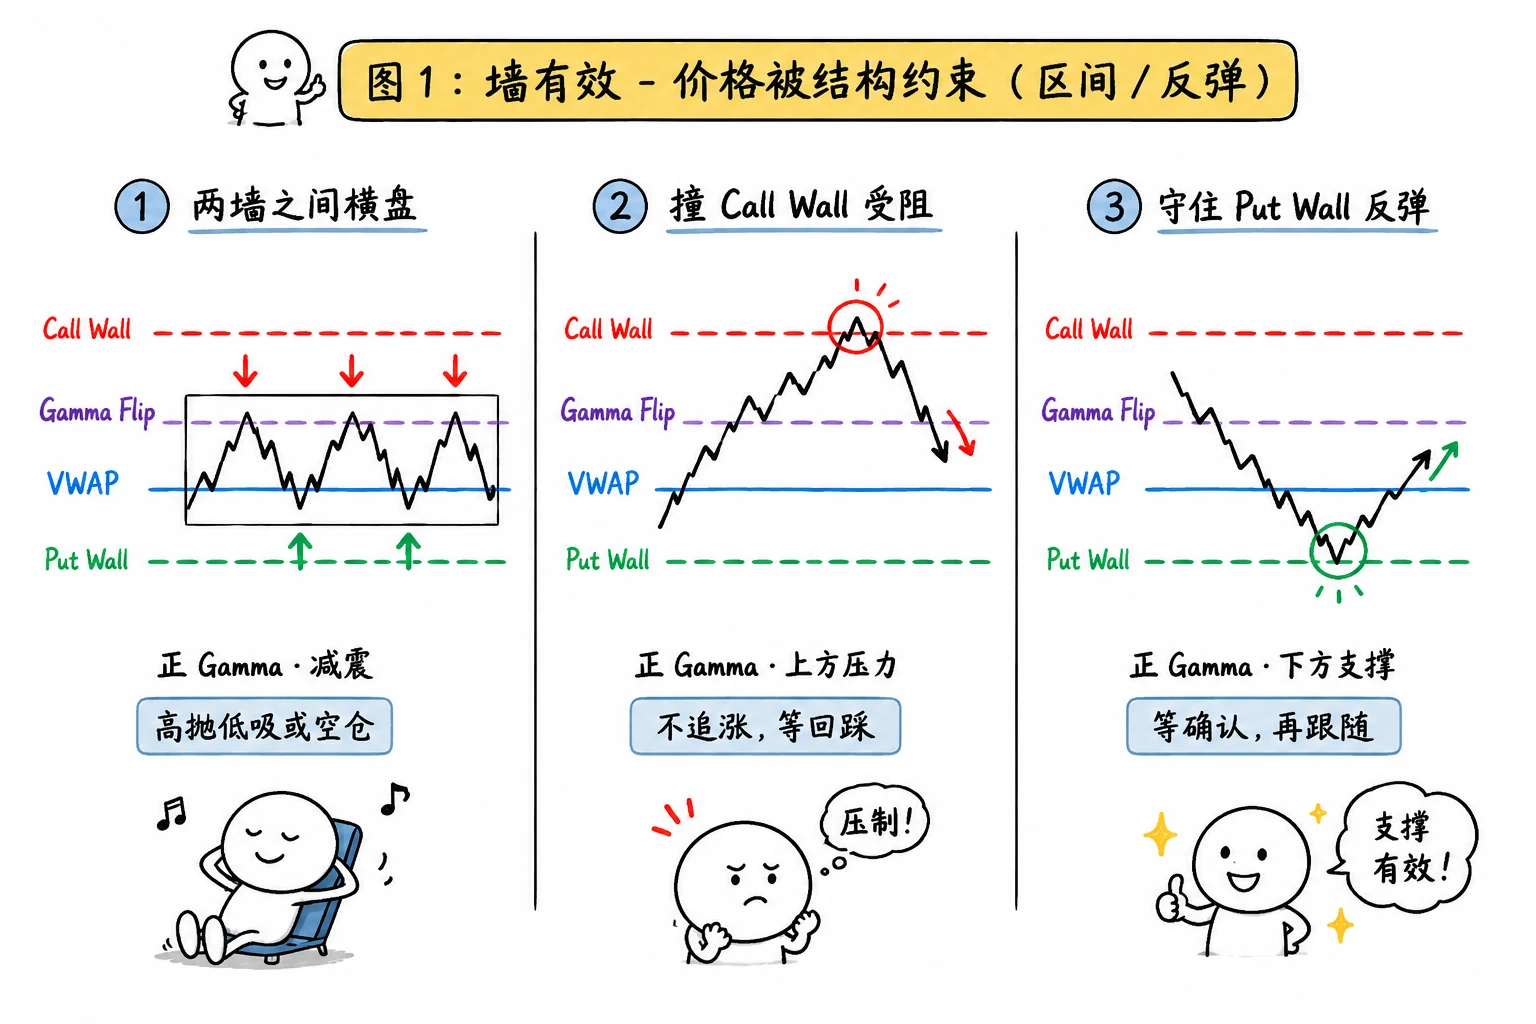
The Call and Put Walls still function. Price remains between them or is rejected by one wall, a common positive-Gamma shock-absorber pattern.
1. Range between the walls. Price travels between the Put and Call Walls, repeatedly reversing at them while VWAP stays roughly flat. Counter-trend market-maker hedging suppresses volatility and the market lacks persistent direction. Chasing either side invites repeated whipsaws. A short-premium trader may fade the edges, but in this Buyer Edition, doing nothing through the middle is often the better outcome.
2. Rejection at the Call Wall. A Call Wall does not begin only when price touches an exact line. Pressure can appear in advance. I divide the approach into three rough zones; adjust them for the SPX level and daily volatility:
- Within roughly five points, price slows before contact. Hedging flow and profit-taking appear early; incremental buying cannot keep pace. Many Calls die before the wall as capital leaves and momentum fades. February 17 displayed this grind before 6850.
- At the Call Wall. Price touches the wall, stalls, and prints small candles as momentum fades. Observe or take profit; do not chase a Call at the wall.
- One to ten points above, followed by an immediate return. A classic upside liquidity sweep: stops and breakout buyers above the wall are consumed, then price falls back. Ask whether the retest can hold the Call Wall. Failure means the wall remains valid. Acceptance points instead toward the next scenario, where the wall has moved.
3. Rebound from a defended Put Wall. The Put side is symmetric. Again, the question is not simply whether price crossed the wall but whether the wall still holds after the reclaim:
- Within roughly five points, the decline slows before contact. Buyers and short covering appear early. Many Puts fail before the wall as shorts cover and selling pressure fades.
- At the Put Wall. Price stops declining and grinds with small candles. Observe rather than betting on the first touch.
- One to ten points below, followed by an immediate reclaim. A classic downside liquidity sweep, like February 13. If the retest holds above the Put Wall, the wall remains valid. If the reclaim fails and price leaks through again, consider the collapsed-wall scenario.
Wall Failed: the Original Structure Breaks
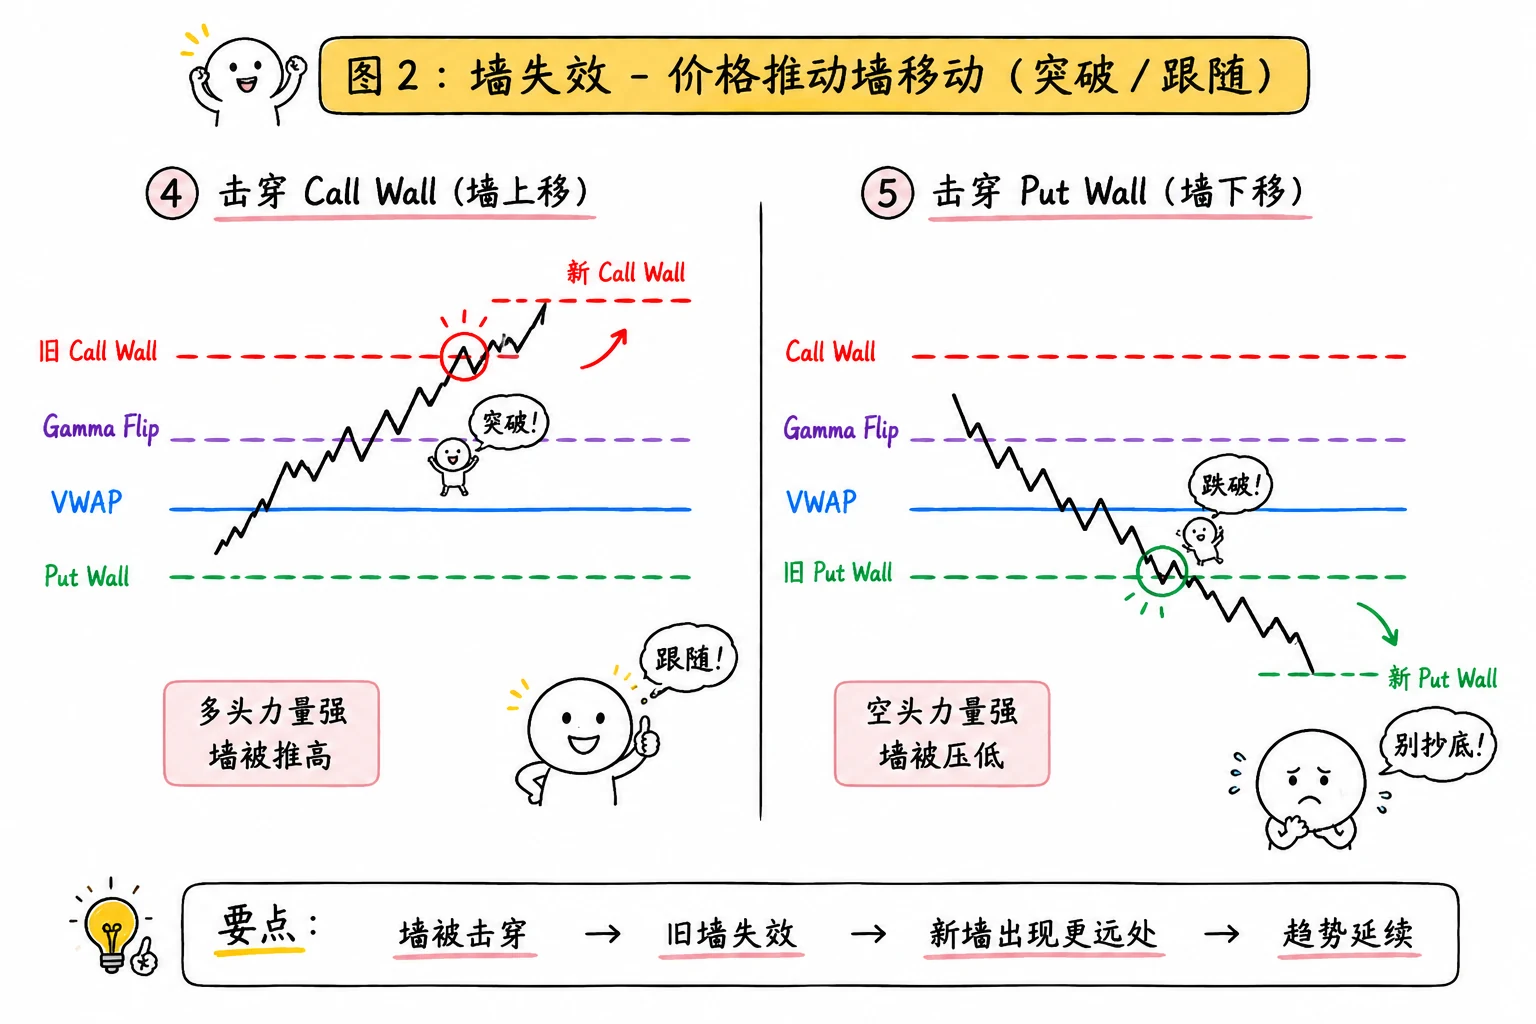
When force overwhelms the old wall, stop asking whether it still holds and locate the new structure.
4. Call Wall breaks and moves higher. Price crosses the Call Wall on Volume and remains above it. Old overhead pressure has been absorbed; the market accepts a higher range. New Call positions accumulate and the Call Wall moves higher, often alongside trend acceleration. June 4 in Chapter 1 was the classic example: after 7550 broke, new walls appeared at 7570, 7575, and 7590 while price stayed above VWAP. Recognize the new wall and stop defending the old one. Require acceptance; do not chase the first print through.
5. Put Wall breaks and collapses. Price falls below the Put Wall, cannot reclaim it, and continues lower. Existing support has failed. Under negative Gamma, a macro shock, or a powerful trend, the wall may not hold. March 26 in Chapter 6 shows the same wall meeting a different fate. Do not force a rebound trade. Watch for a reclaim, locate VWAP, and wait for new structure.
Character Changed: the Market Mechanism Switches
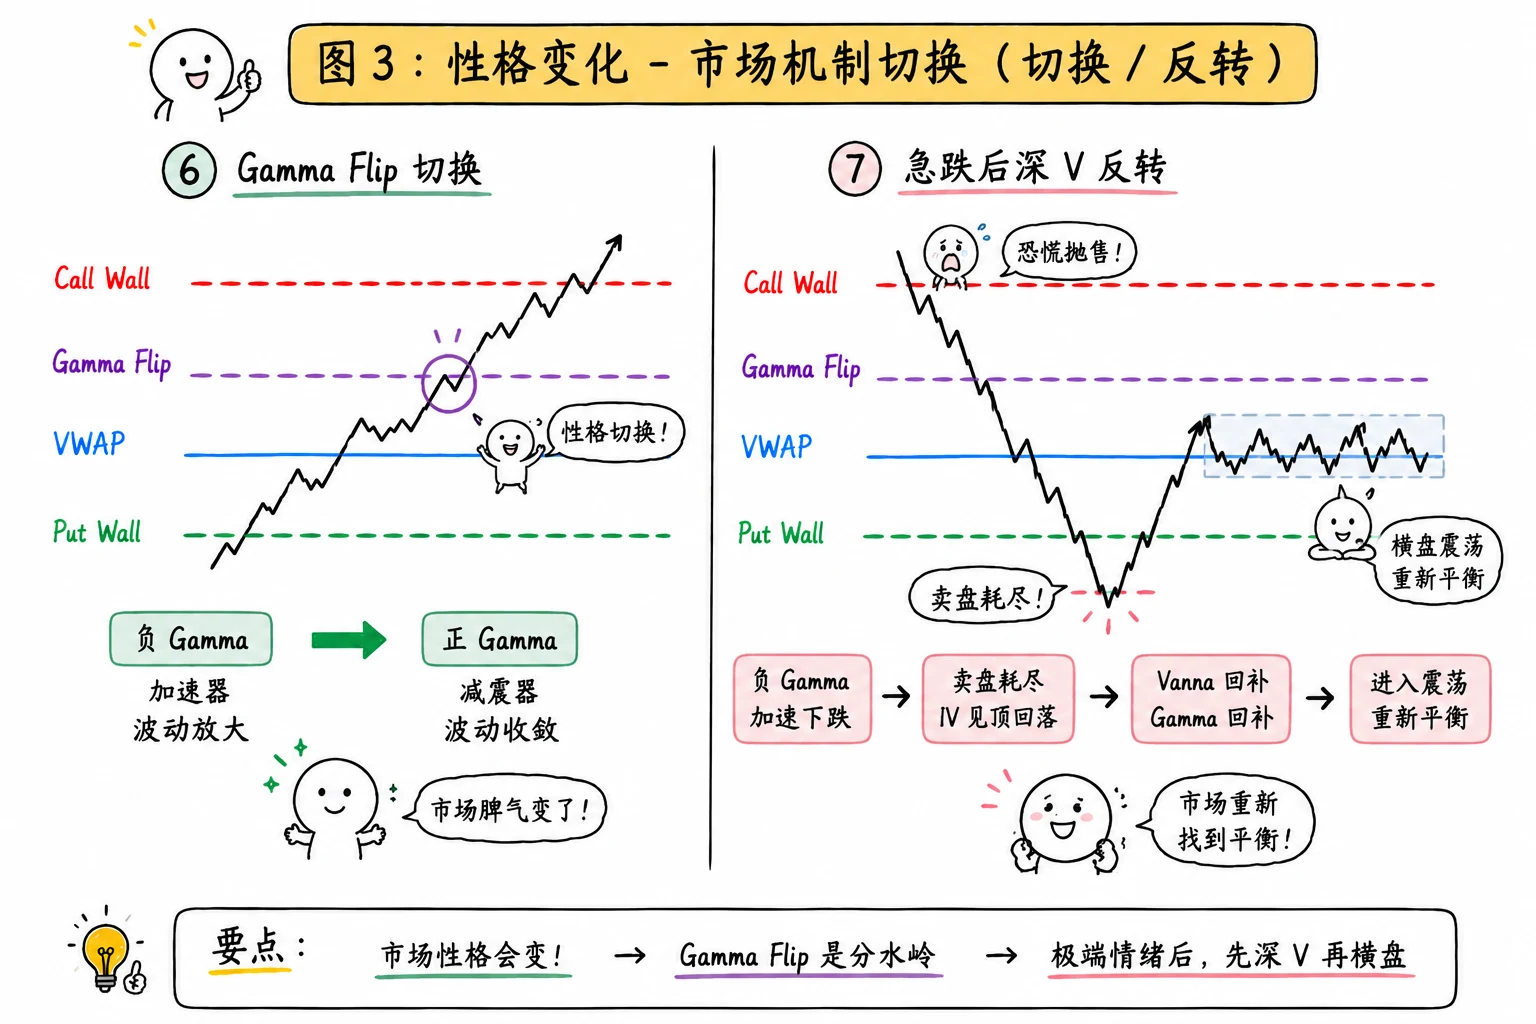
Here, the important change is not a wall shifting several points. The damping/acceleration mechanism itself changes.
6. Gamma Flip transition. Price crosses the Gamma Flip and moves from negative to positive Gamma, or the reverse—like throwing a character switch. Positive Gamma brings counter-trend hedging and damping; negative Gamma brings pro-cyclical hedging and amplification. Crossing the Flip changes the feedback mechanism, not merely another line. It does not automatically determine direction. Above is not inherently bullish; below is not inherently bearish. Price action, VWAP, and key levels still confirm direction. Holding above 6810 on February 17 was one element of right-side confirmation; positive Gamma did not power the subsequent rally.
7. Deep V after a sharp decline. Price rebounds in a deep V but does not necessarily begin an immediate one-way rally; it often enters a new balance. A common sequence is negative Gamma amplifying the decline → sellers becoming exhausted → market-maker covering combined with Vanna-related flow as IV falls. A deep V does not require a Put Wall. On many days, selling is exhausted before price reaches one. The move is a rebalance after extreme disequilibrium, not merely “a bounce from the wall.” Do not keep shorting by habit. For a reversal, watch whether IV falls and the absolute magnitude of GEX converges.
Summary
| Category | Core question | Figure |
|---|---|---|
| Wall valid | Is price still constrained by structure? | 5-17 |
| Wall failed | Has price broken the original structure? | 5-18 |
| Character changed | Has the market's feedback mechanism switched? | 5-19 |
The seven paths reduce to one sentence: first ask whether the wall remains valid; if it failed, ask whether the market's character changed. Recognize the path rather than memorize a script. Then add VWAP and the day's GVP filter to decide whether to trade. Discipline and position size handle the rest.
Price changes every day, but the market keeps answering the same question: Is the wall still valid? If not, did the character change?
This chapter contained many pieces: three premarket tasks, VWAP, price action, GVP, contract selection, and seven typical paths. They all perform one job: reduce the day from infinite possibilities to several, then choose only the one or two moments when structure speaks on my behalf.
During my first two years, I thought more information meant greater safety: ten indicators, five timeframes, and a screen full of lines. Instead, more noise gave me more reasons to improvise.
I slowly came to believe something counterintuitive: progress in trading often means not learning another trick, but daring to remove one. After enough subtraction, my screen held only a few GEX walls, one VWAP line, and price action. When all three agree, I act. When they argue, I do not.
And “do not” is the hardest and most valuable technique in the method. The market opens every day. Today's opportunity is never the last one. The ability to hold your hand often determines longevity more than the ability to predict direction.
In the next chapter, we return this premarket work to three real sessions with entirely different personalities: a deep V, bearish GVP pressure, and the day promised support collapsed.