Chapter 6 · Three Market Personalities: Deep V, Confluence, and Wall Collapse
Opening verseTo the Tune of Zhe Gu Tian · Watching the Market
Candles rise and sink like tides;
red and green contend along the walls.
As price climbs, dip-buyers laugh;
as it falls, I keep silent while others chase the short.
The wind is unsettled; no trend can be found.
Three tests of the low examine the heart.
Who knew one day could change from storm to sun,
and return in a V with blood across its robes?
This chapter returns the tools from the preceding chapters to real markets.
The same GEX map and the same method can look entirely different inside three sessions with different personalities:
- February 27, 2026—a deep V, where a sharp decline was pulled violently back
- March 18, 2026—a persistently weak session in which every rebound was rejected: bearish GVP alignment
- March 26, 2026—the day the promised Put Wall support collapsed
Whether price rises, falls, or grinds is not the central question. First recognize what kind of day this is. Then watch what happens when structure behaves as expected—or unexpectedly fails—and how I respond or make mistakes.
February 27, 2026 · SPX 0DTE: Negative Gamma Does Not Mean an Endless Decline
SPX made the deep V shown in Figure 6-1.
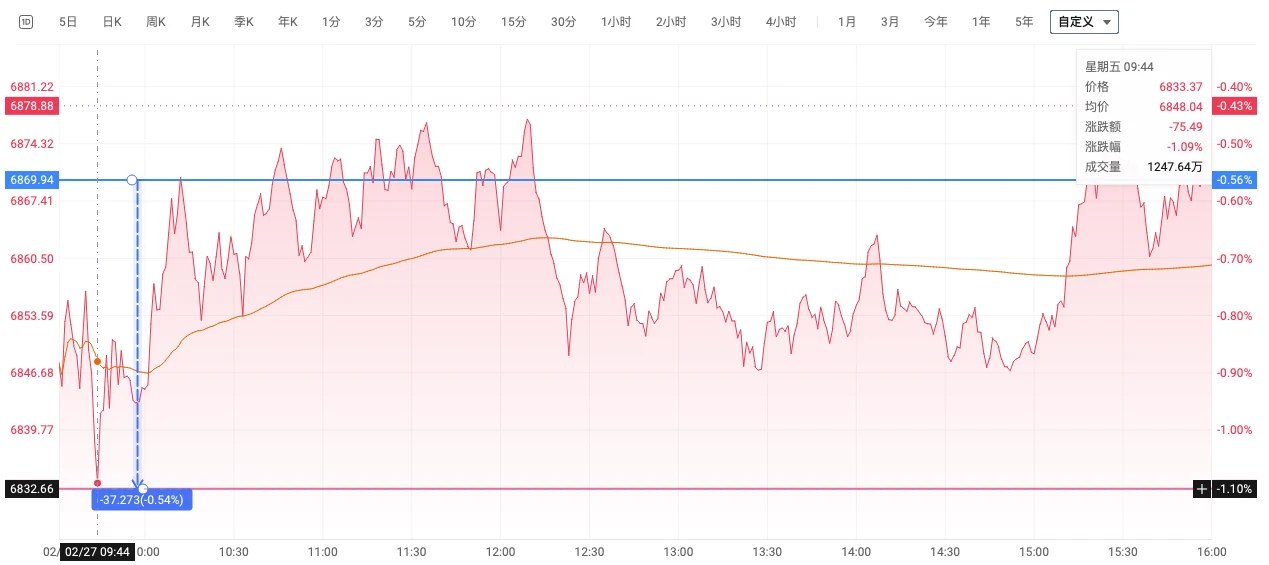
Everyone asked the same question:
Gamma was still negative. How could the market reverse in a V?
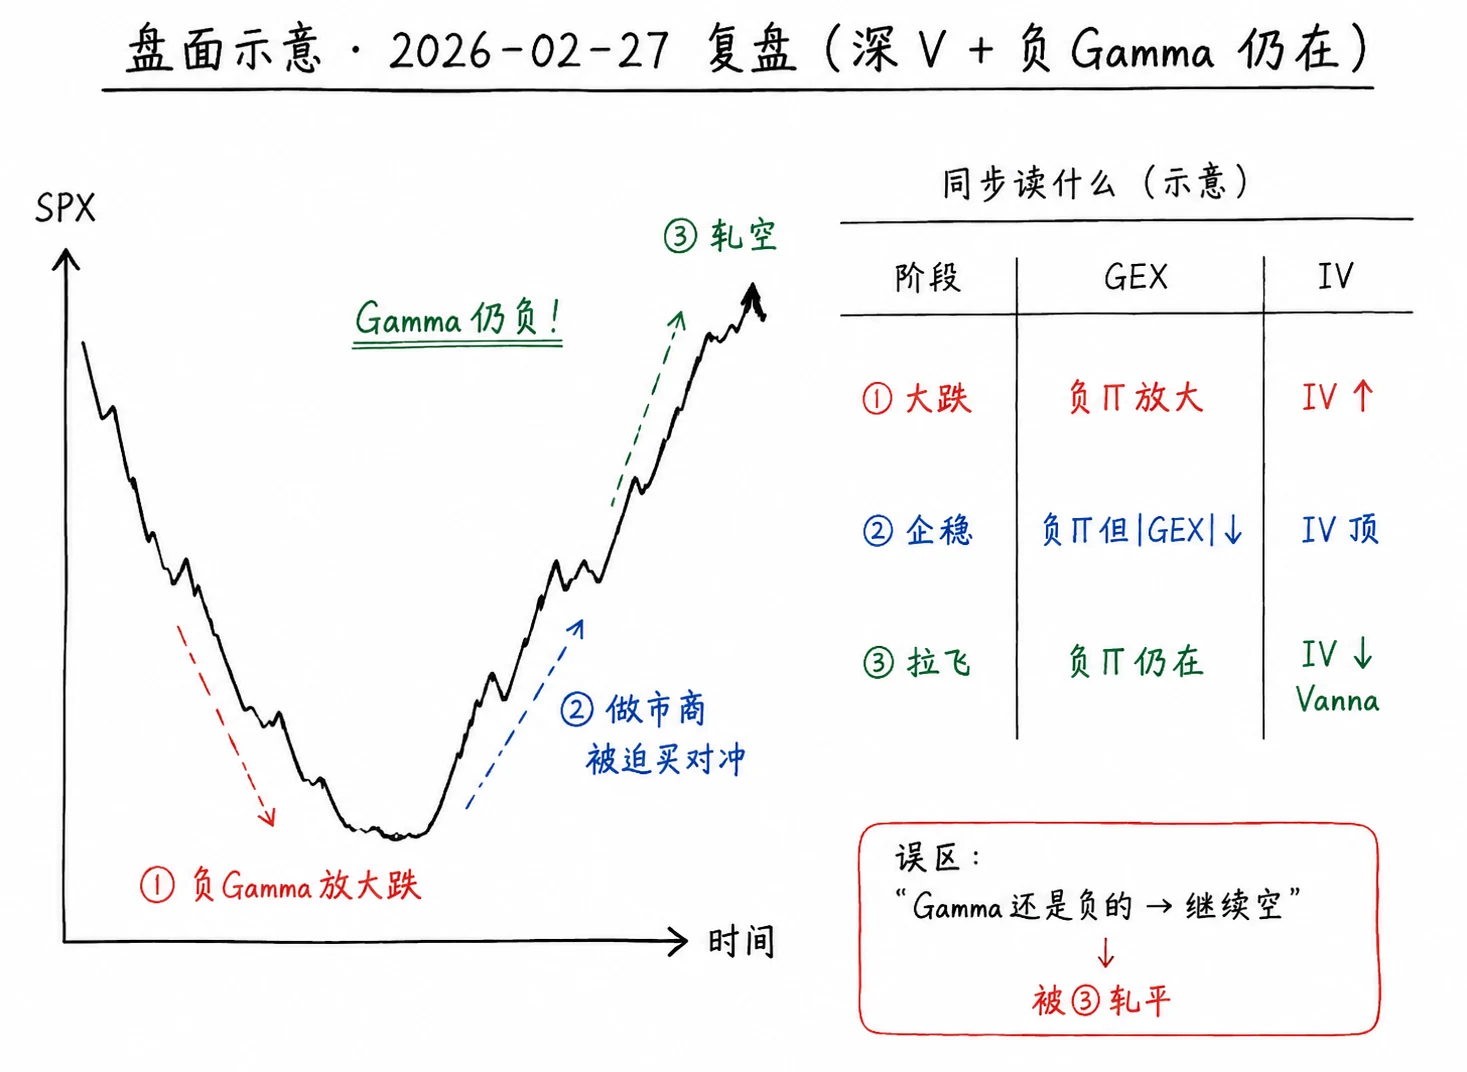
This section uses that session to answer the question. Chapter 3 gives the complete Vanna mechanism. Figure 6-2 condenses it into three linked stages: selloff, IV surge, and Vanna-related covering.
What Happened That Day
Stage 1: the selloff
- Negative Gamma amplified the decline
- IV surged
- Selling largely exhausted itself and the order book became thin
Stage 2: stabilization
- Meaningful external buying lifted price
- Under negative Gamma, market makers had to buy hedges as price rose—an obligation, not an opinion
- Buying struck a thin book and price accelerated upward
Stage 3: Vanna added force
- As price stabilized, IV began to fall
- Short hedges held against tail risk became excessive
- Market makers had to buy them back
- At the start of a V, that flow can be more violent than Gamma itself
The Underlying Logic
Treating negative Gamma as a reason to keep shorting is one of the easiest ways to fail in a deep V.
Negative Gamma does not mean “price keeps falling.” It is a volatility amplifier.
When price falls, market makers sell and reinforce the decline. When price rises, they buy and reinforce the rally.
“Gamma is still negative” and “the market formed a V” are therefore perfectly compatible. Once price begins rising, compelled hedging can accelerate the recovery.
Negative Gamma chooses no side. It assists whichever side is moving.
As the market fell, my finger hovered over the keyboard. Two voices argued in my mind.
One said, “Short it. The trend is on your side.”
The other said, “Wait. Last time you chased the bottom and the V tore through you.”
I waited.
Not because I was clever, but because previous squeezes had taught me fear. I had written one sentence after the last one: negative Gamma chooses no side; it helps whoever moves. If I do not know which side moves next, I do not choose a side after an extended decline.
The Three Dimensions I Watched
After a large decline inside a negative-Gamma region, I ask three questions:
- Is the absolute magnitude of GEX shrinking or expanding? Movement toward zero means hedging pressure is easing
- How far is price from the Gamma Flip? Stabilization and movement toward the Flip can precede structural change
- What is IV doing? A fall from elevated levels can activate Vanna-related flow
Only confluence across all three makes me seriously consider a reversal.
Any one dimension can become a trap.
I used to see red, negative Gamma, chase the short, and be flattened by the V. Now, after a major decline, I first ask “Could this reverse in a V?”, not “Can I still short?”
March 18, 2026 · SPX 0DTE: Bearish GVP Alignment
Figure 6-3 shows VWAP pressing down on price throughout the session while GEX and price action stood on the same side.
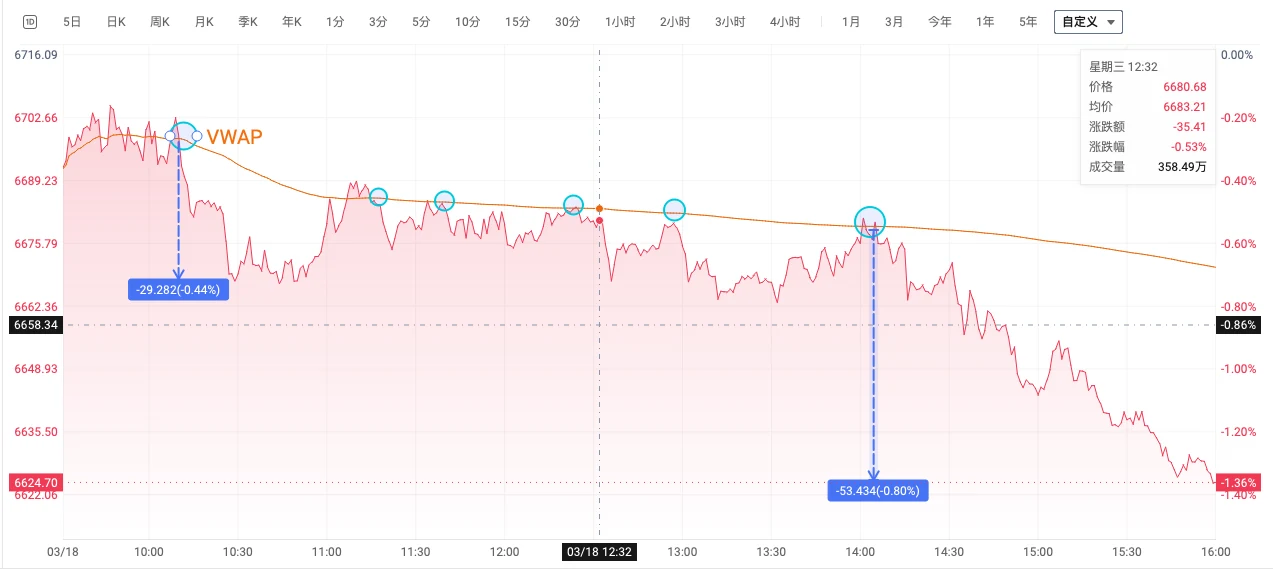
Not every day produces a textbook move. March 18 nonetheless displayed the bearish version of GVP from Chapter 5: all three dimensions pointed the same way. Figure 6-4 combines price below the Flip, VWAP as a ceiling, and rebounds that failed on contact.
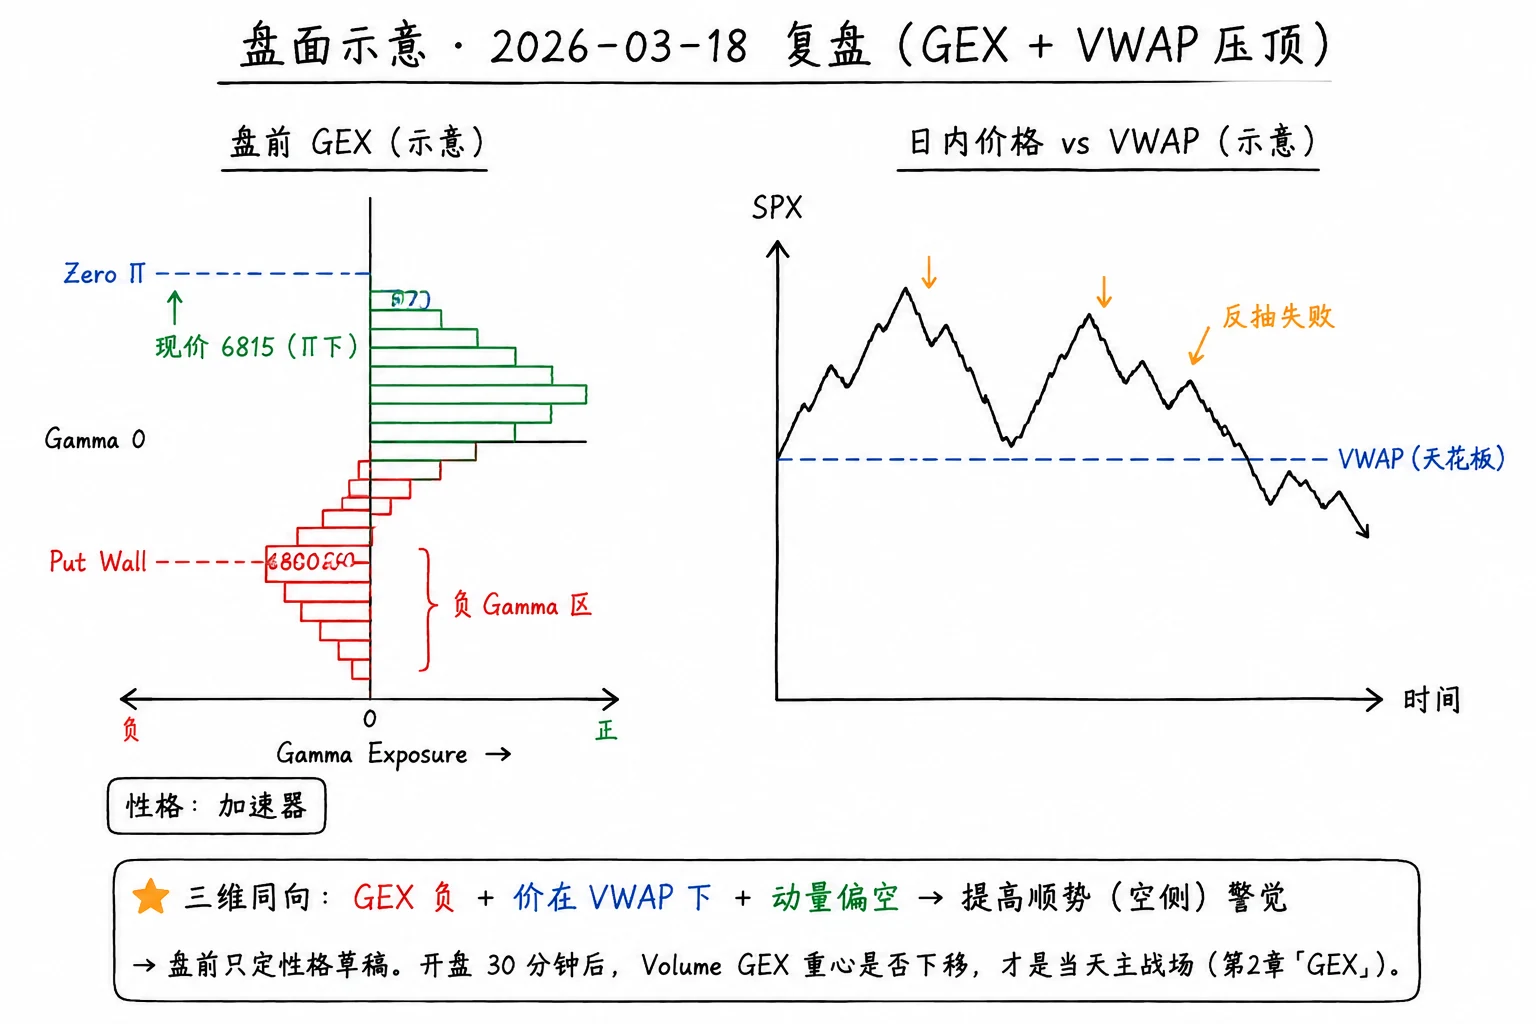
My reading after the open: spot was below the Gamma Flip, so I prepared for the negative-Gamma side. The first zone of concentrated Volume below was 6800.
Premarket defined only a draft of character. After the first 30 minutes, the location of Volume determined the day's real battlefield.
VWAP as a Ceiling
SPX failed to hold above VWAP after the open. Every subsequent rebound toward VWAP was rejected.
Most buyers who entered above VWAP quickly became trapped. On each return to the cost line, trapped longs seeking breakeven, short covering, and new short entries combined into recurring pressure.
| Approximate period | Price vs VWAP | Reading |
|---|---|---|
| 09:45–11:00 | Continuously below | Cost basis became a ceiling, not a moving average |
| 11:00–13:00 | Repeated VWAP tests failed | Bearish structure remained intact |
| After 14:00 | Still unable to hold above | The cost dimension of GVP remained valid all day |
Below the Gamma Flip
SPX remained below the Gamma Flip throughout the day in a negative-Gamma region.
The hedging consequences were:
- When price fell → compelled selling → a cleaner decline
- When price rose → compelled buying → rebounds that still proved short-lived
This does not mean negative Gamma produces an endless decline. It describes the character of volatility. That day, price also happened to be below its key levels, so both dimensions combined into the experience of rebounds that could not survive.
Price Action
Momentum remained bearish. Rebound highs kept falling, and price never reclaimed the Gamma Flip.
With GEX and VWAP already aligned, price action increased confidence that the move was not a simple false break. It did not mean “short because an indicator crossed.” It meant fewer impulses to catch the knife inside weak rebounds.
GVP
| Dimension | March 18 condition | Question answered |
|---|---|---|
| GEX | Below Gamma Flip; negative Gamma | The day behaved more like an accelerator |
| VWAP | Price remained below the cost line | Most participants were losing; rebounds met pressure |
| Price action | Short-lived rebounds and lower highs | Not a vertical collapse, but a slow decline with weak rebounds |
In my framework, this was GVP alignment that increased respect for the trend structure. Alignment did not make the trade certain.
Indicators and candles can mislead, but it is difficult for VWAP—the actual cost basis—GEX—hedging flow—and price action to lie together for long.
Direction was not the hardest part. G, V, and P were cleanly aligned.
The hard part was refusing to buy the dip.
After every leg lower, a voice said, “Surely this is enough. Surely it should bounce.”
But every rebound to VWAP failed. Those short-lived green candles reminded me of every falling knife I had tried to catch.
I learned that bearish GVP does not say, “Price must fall.” It says, “Following the move offers far better conditions than fighting it today.” You do not need to prove that you are clever. You need to restrain the hand that wants to pick the bottom.
Where a Long Could Have Failed
- “It has fallen enough and must bounce.” Catching a knife below VWAP in negative Gamma; the rebound reaches VWAP and fails
- “A broken Put Wall must rebound.” March 18 was not February 13; under negative Gamma, a wall may stop price only once
- “GVP aligns, so I should use full size.” Alignment raises attention, not guaranteed win rate. Sizing is a separate system; see Chapter 7
March 26, 2026 · The Day the Wall Collapsed
March 26 taught me what “walls can collapse” really means.
I watched three moments:
- Price approaching the Put Wall
- Price attempting to rebound there
- Price breaking through it
What Happened: One Wall, Two Breaks
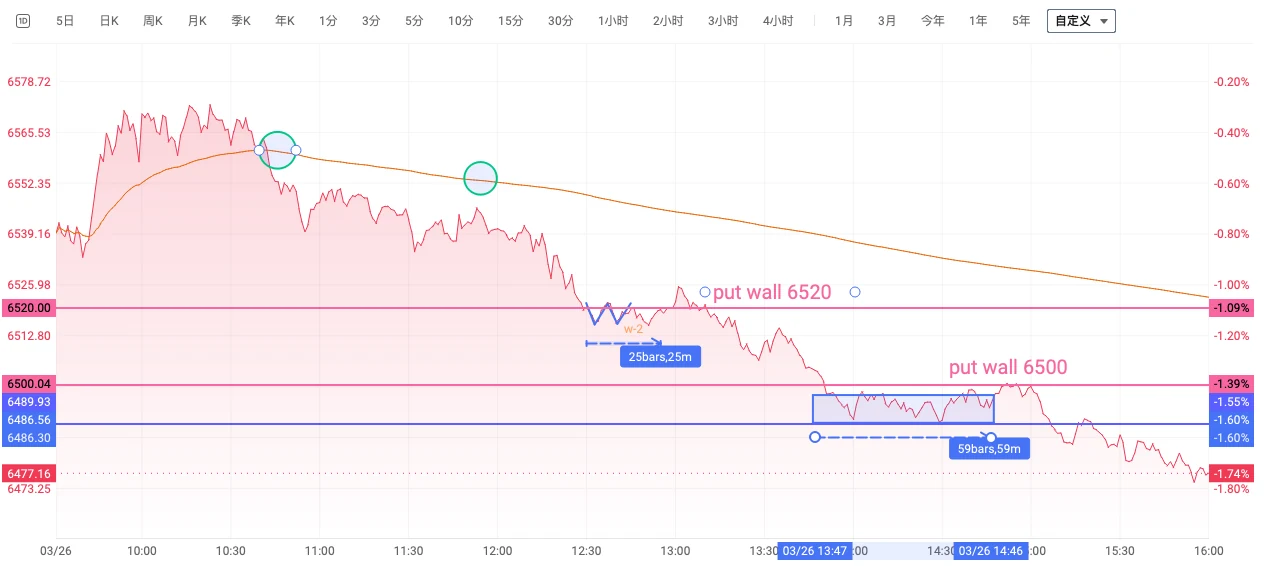
Soon after the open, price fell below VWAP—the thin orange line in Figure 6-5—and below the Gamma Flip. The market was in negative Gamma, with market makers hedging pro-cyclically: selling futures during declines, while buying into rebounds produced only brief recoveries.
First contact with the 6520 Put Wall
Around 10:43, price moved toward the first Put Wall at 6520. It touched and did not rebound. It broke straight through.
I thought: perhaps this is only a liquidity sweep. Let me see whether it returns.
A W bottom attempted a reclaim
From 12:11 to 12:54, price tried to build a W below 6520 and repeatedly tested upward.
Every rebound failed. It was not that buying had no force; too much weight remained overhead. VWAP was distant, the Gamma Flip sat above, and pro-cyclical hedging made each buying wave feel as though it struck padding.
Second break: the wall was gone
At 13:10, price broke 6520 again. This time the Put Wall no longer stood there. It had moved lower.
I refreshed the platform. The new Put Wall appeared at 6500, also a psychological round number with clustered stops.
Breaking 6500
At 13:50, price broke 6500 and continued to 6490, exactly ten points below the round number—a classic stop-run location.
The market then traded sideways between 6490 and 6500 for almost 59 minutes. Five or six attempts to rebound above 6500 all failed.
Only then did I fully accept it: the Put Wall had become resistance rather than support.
Price continued lower near the close, finishing the one-way session down roughly 1.3%.
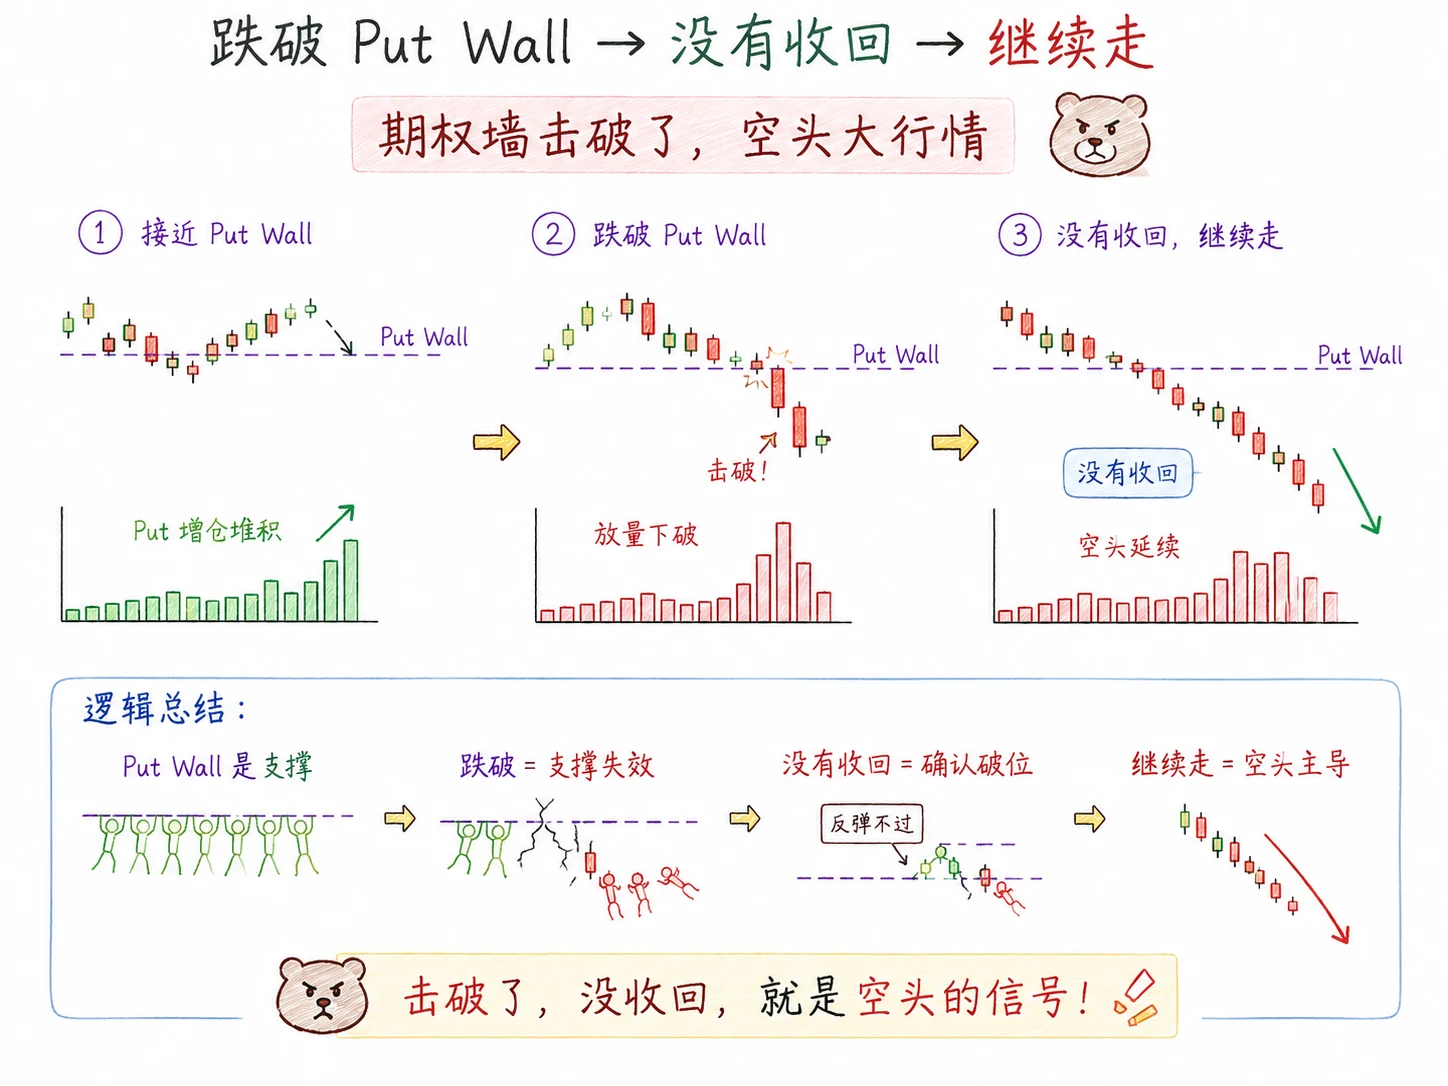
The Put Wall rebound did not materialize. That session turned “a wall is probability, not a guarantee” from an idea into something I witnessed. Figure 6-7 compares the two fates of the same structure: reclaim produces one script; failure to reclaim produces another.
February 13 Held; March 26 Collapsed
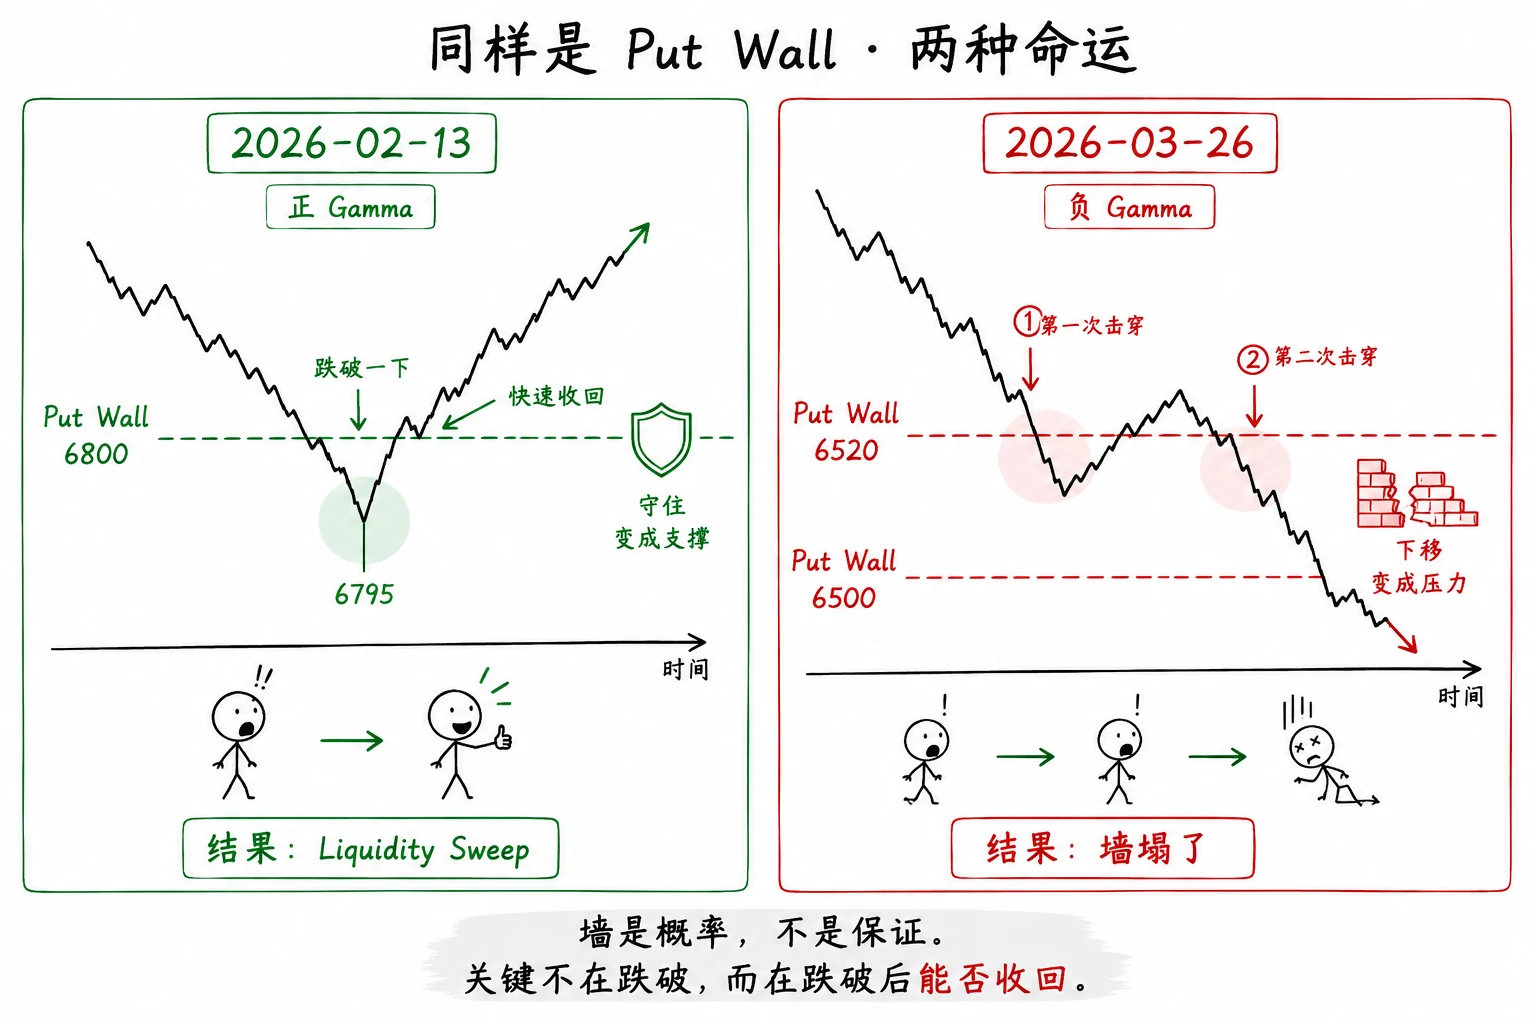
Recall February 13. Price also attacked a Put Wall, but that wall held. The market briefly broke it, swept stops, and reclaimed it. Positive Gamma dampened the decline: a textbook false break.
On March 26, the same kind of wall and the same general logic failed.
A Put Wall is not absolute support. Under negative Gamma, a strong trend, or a macro event that overwhelms structure, the wall can collapse.
| February 13 | March 26 | |
|---|---|---|
| After the break | Brief excursion, then quick reclaim | Two breaks, no reclaim |
| Regime | Positive Gamma | Negative Gamma |
| Wall response | Held and became support | Moved lower and became resistance |
| Outcome | Liquidity sweep | Wall collapse |
A wall is probability, not a guarantee.
What the Day Taught Me
After the first break, you can still wait. After the second, reassess whether the wall has failed.
A lower Put Wall is an alarm. A Put Wall changing from floor to ceiling confirms collapse.
Repeated failed rebounds and prolonged trading below the wall mean it is time to abandon the rebound script.
A script may be wrong. An exit cannot be missing. Before entry, decide where you leave if this trade belongs to the minority of cases that fail.
False Break vs Genuine Break
Before acting, I watch one thing: after breaking below, does price return above the wall?
On a genuine break like March 26, price cannot regain the Put Wall and offers no meaningful bounce. Do not rush to buy or force the false-break script.
The earlier me: a wall breaks, so I must either chase the short or buy the dip. I always needed an action.
The current me: a wall breaks, so I watch how price tries to return. If it cannot, I do not trade the rebound script.
Most false breaks reclaim relatively quickly, like February 13. On a genuine break like March 26, stop forcing the rebound. Watch the reclaim and VWAP.
Breaking Through Human Nature
The day's hardest problem was psychological, not technical.
Entering under the February 13 false-break script was not inherently wrong. The error was that when the wall failed to bounce, the script contained no answer to “What if it does not return?”
As price continued lower, the most dangerous thought appeared: “Add more, lower the average cost, and wait for it to come back.”
Add to the mistake → reinforce the wrong direction → average down without limit. Chapter 7 returns to this destructive chain.
The Put Wall rebound may remain the higher-probability outcome in some conditions. Higher probability has never meant 100%.
Before every script, decide: if this is one of the cases where the idea fails, where do I leave?
A script may be wrong. An exit cannot be missing.
I sat before the screen for a long time after the close.
Not because of the size of the loss. I had believed I understood that walls are probabilities rather than promises. Yet when the wall truly collapsed and the rebound trade failed, I still panicked, wanted to add, and imagined a reclaim.
The distance between knowledge and action is not comprehension. It is bodily memory. Knowing that a wall can collapse and experiencing the collapse without reacting impulsively are two different things.
I added one line to my journal:
The next time I see a Put Wall, ask: if it does not return this time, am I ready?
What I Want You to Take from This Chapter
- Negative Gamma is an amplifier, not an endless decline. Do not know only how to chase a short inside a deep V; Gamma may remain negative during the turn
- Bearish GVP: VWAP overhead + below Gamma Flip + short-lived rebounds. Alignment raises alertness, not position size
- Walls collapse. A Put Wall is not an iron floor. For false vs genuine breaks, watch the reclaim, not the initial break
- A script may be wrong; an exit cannot be missing. Decide where you leave before entry
Notes from My Journal
Together, the three days resemble pages torn from a review notebook:
“Gamma is still negative. How did the market form a V?” Negative Gamma is an amplifier, not a directional vote. After a large decline, I ask whether a V can form before asking whether I can still short.
On March 18, VWAP remained overhead all day. GVP alignment does not guarantee a large profit, but it can keep me from being cut repeatedly inside weak rebounds.
On March 26, I used the February 13 script to buy the Put Wall, and price did not return. A wall is probability, not a promise. Every script must state where I leave if it fails.
This chapter returned the tools to real markets: a deep V, bearish GVP, and a collapsed wall.
The same method must be applied differently to days with different personalities.
The next chapter leaves market reading for something more important: survival matters more than winning one trade—exits, events, and position size.
Calling the direction correctly does not mean realizing a profit. That is the subject of the next chapter.