Chapter 4 · Two Paths at the Wall: False Break and Genuine Breakout
Two trading days, two opposite paths. On February 13, price made a false break, swept the level, and reclaimed it. On February 17, price made a genuine breakout, held above the Gamma Flip, and advanced to the Call Wall.
February 13, 2026 · SPX 0DTE: A Textbook Liquidity Sweep
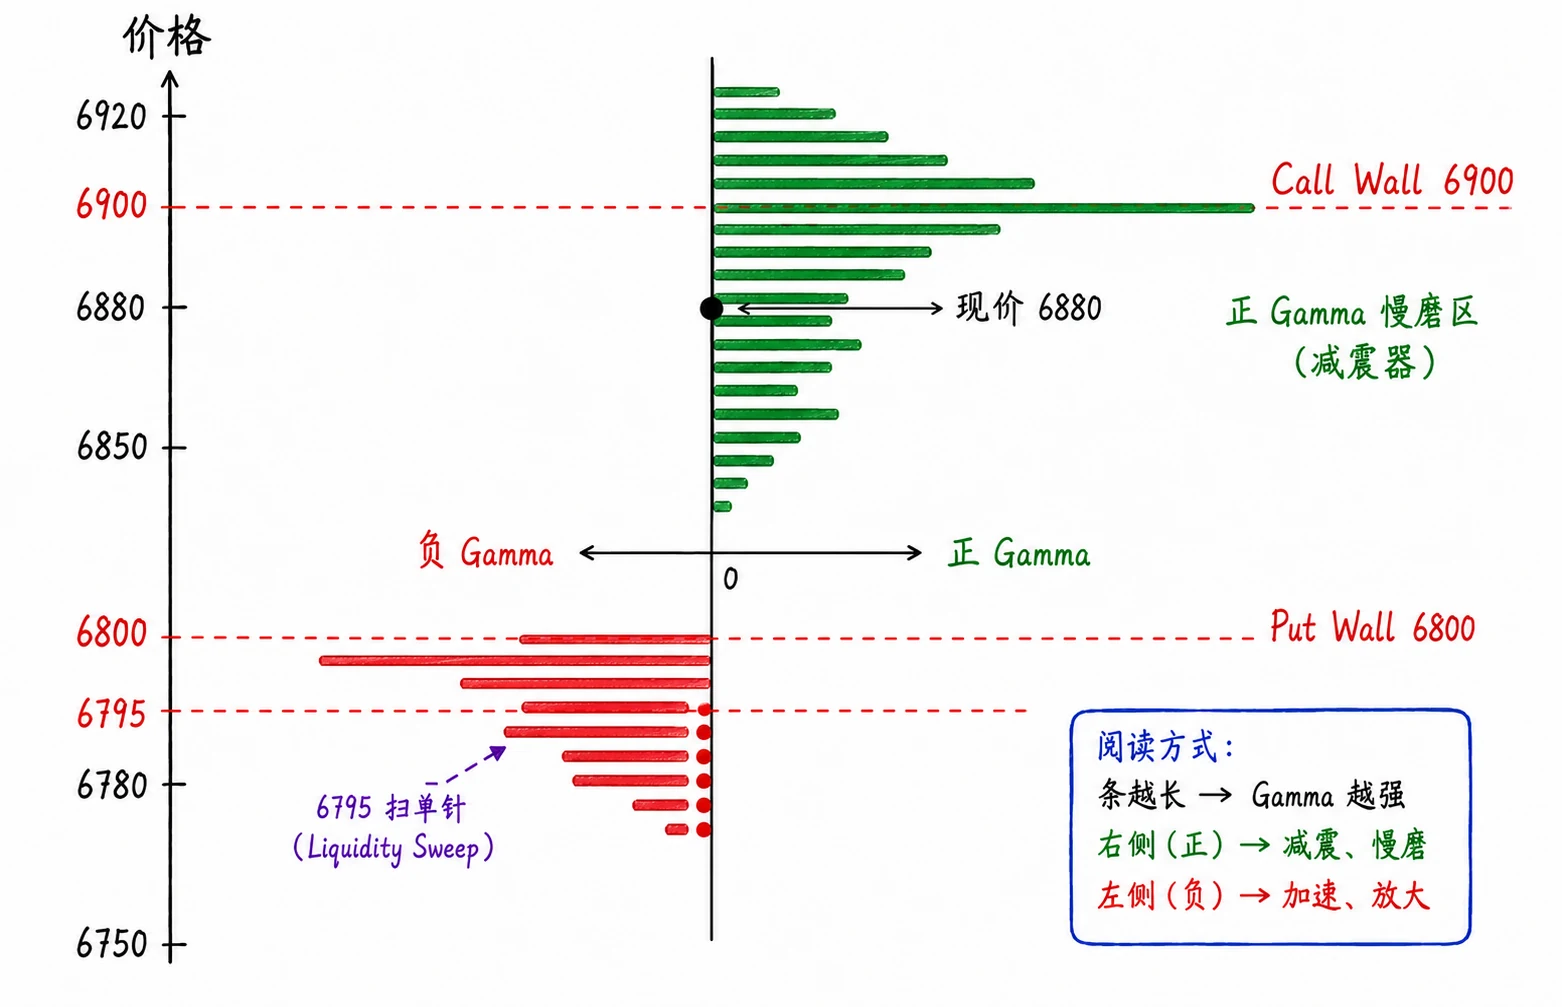
After the open that evening, I confirmed two levels:
- Put Wall @ 6800
- Call Wall @ 6900
The range was clear: a full 100 points from 6800 to 6900.
All I had to do was wait for the market to show which side it wanted.
Figure 4-1 shows those two walls on the day's GEX map.
The Open: Price Broke the Put Wall, but I Did Nothing
The market sold off after the open. Fear rose.
That was the candle's low. Its lower wick pierced the 6800 Put Wall by five full points, but the candle closed at 6799—nominally only one point below the wall.
Honestly, I did not act immediately.
A broken wall, by itself, means nothing.
What matters is how price returns.
The earlier version of me would have acted the moment the Put Wall broke. I would either chase the short—“The level broke; get in”—or buy the dip—“This is support; it has to bounce.”
Both impulses came from the same flaw: an inability to tolerate doing nothing.
Sitting in cash, waiting, and watching price pierce a key level without acting can feel worse than losing money. But I eventually learned that the market's most expensive action is often the one taken from fear of missing out.
The lower wick did not continue. Selling did not extend. Liquidity was swept and then price reclaimed the level.
That was the answer.
Those few points below 6800 were a classic trap: stops were cleared, shorts entered, and price reversed higher. The pattern is called a liquidity sweep; see the Appendix Glossary. February 13 was a classic example at a Put Wall.
A reclaim of 6800 was one signal that made me consider a long. It was not a universal answer—only my judgment in that moment.
Figure 4-2 shows the “pierce and reclaim” most clearly in the day's candle.
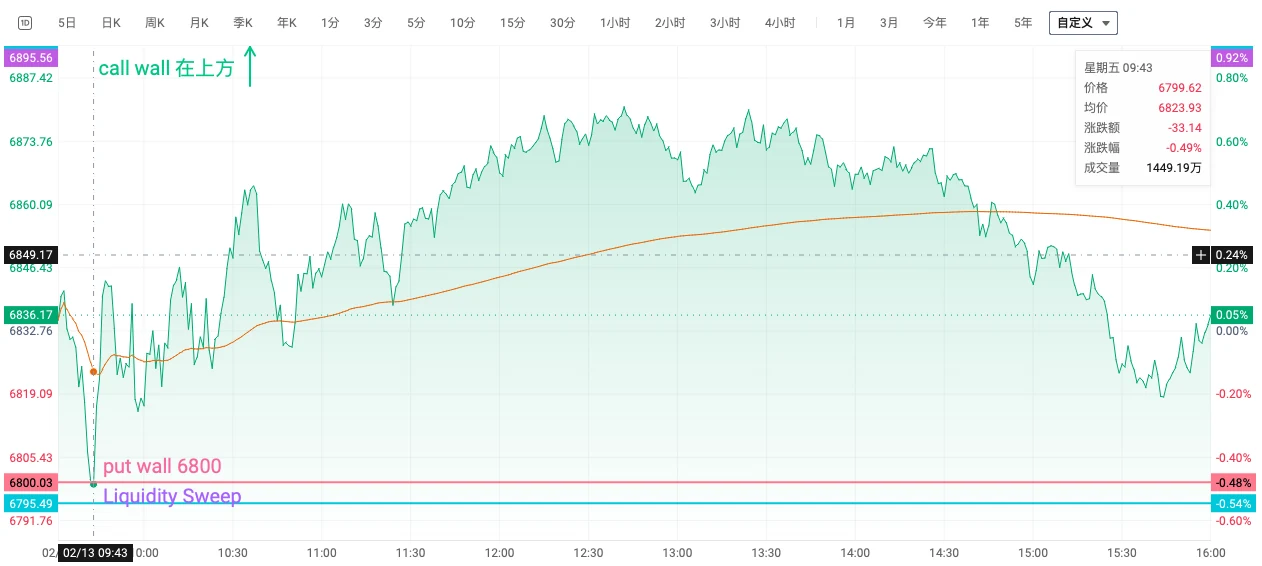
SPX path that day: a lower wick to 6795 pierced the 6800 Put Wall; after the candle closed at 6799, price quickly reclaimed the level.
A Positive-Gamma Regime: The Greatest Test of Patience
After price reclaimed 6800, the path was dull—but the direction was right.
Live platform data placed the session in a positive-Gamma regime. Standing above 6800 does not automatically make Gamma positive; see “Gamma Flip” in Chapter 2. Price ground slowly higher while volatility remained suppressed. Keep two things separate: positive Gamma explains the damping and slower rhythm created by counter-trend hedging; it does not supply the upward direction. The rise still required net buying, price action, and the reclaimed key level. This kind of market tests patience more than anything else.
I used to make my worst mistakes in such “boring” sessions. Price felt too slow, so I traded in and out until fees and slippage consumed the edge.
I thought trading required “action.” Holding still while price ground forward felt like wasted time.
Eventually I learned that not trading is part of trading. A positive-Gamma day is naturally slow. Trying to impose a fast rhythm means fighting the market; the market is not fighting you.
Now I remind myself: on a positive-Gamma day, slow is fast.
As price approached 6880, signs to take profit kept appearing.
The 6900 Call Wall was only 20 points away. Delta-hedging pressure was building as price approached the wall, while the marginal Gamma benefit to the option buyer was fading.
Institutional money does not wait for impact.
Declining Volume near 6880 was one reason I chose to exit.
After the close, I left myself three questions. Near the 6800 Put Wall, did I chase the short? Near the 6900 Call Wall, did I chase higher? When I exited, had the signal actually appeared, or had I simply panicked?
Here, the Put Wall was more than support. It was a dividing line between the two sides. A break tested conviction; holding the wall established the directional case.
But the deeper lesson was this: a liquidity sweep does not succeed every time. A bounce from a wall can fail. Price can break, refuse to reclaim, and continue lower. This February 13 trade worked because three conditions aligned: selling did not continue after the break and price reclaimed quickly; positive Gamma helped dampen the move; and I did not chase a short at 6795.
The earlier version of me would have shorted the break of 6800, been swept, held the loss, and eventually blown up. Now, after a break, I first watch how price attempts to return. Only after confirmation do I consider direction. The difference was not the GEX chart. It was execution.
February 17, 2026 · SPX 0DTE: From Gamma Flip to Call Wall
The market escaped a negative-Gamma trap, crossed the Gamma Flip, and finally met the Call Wall.
February 17 remains one of the most structurally complete sessions in my memory. Every step from entry to exit could be compared with the GEX map.
Three Coordinates Before the Open
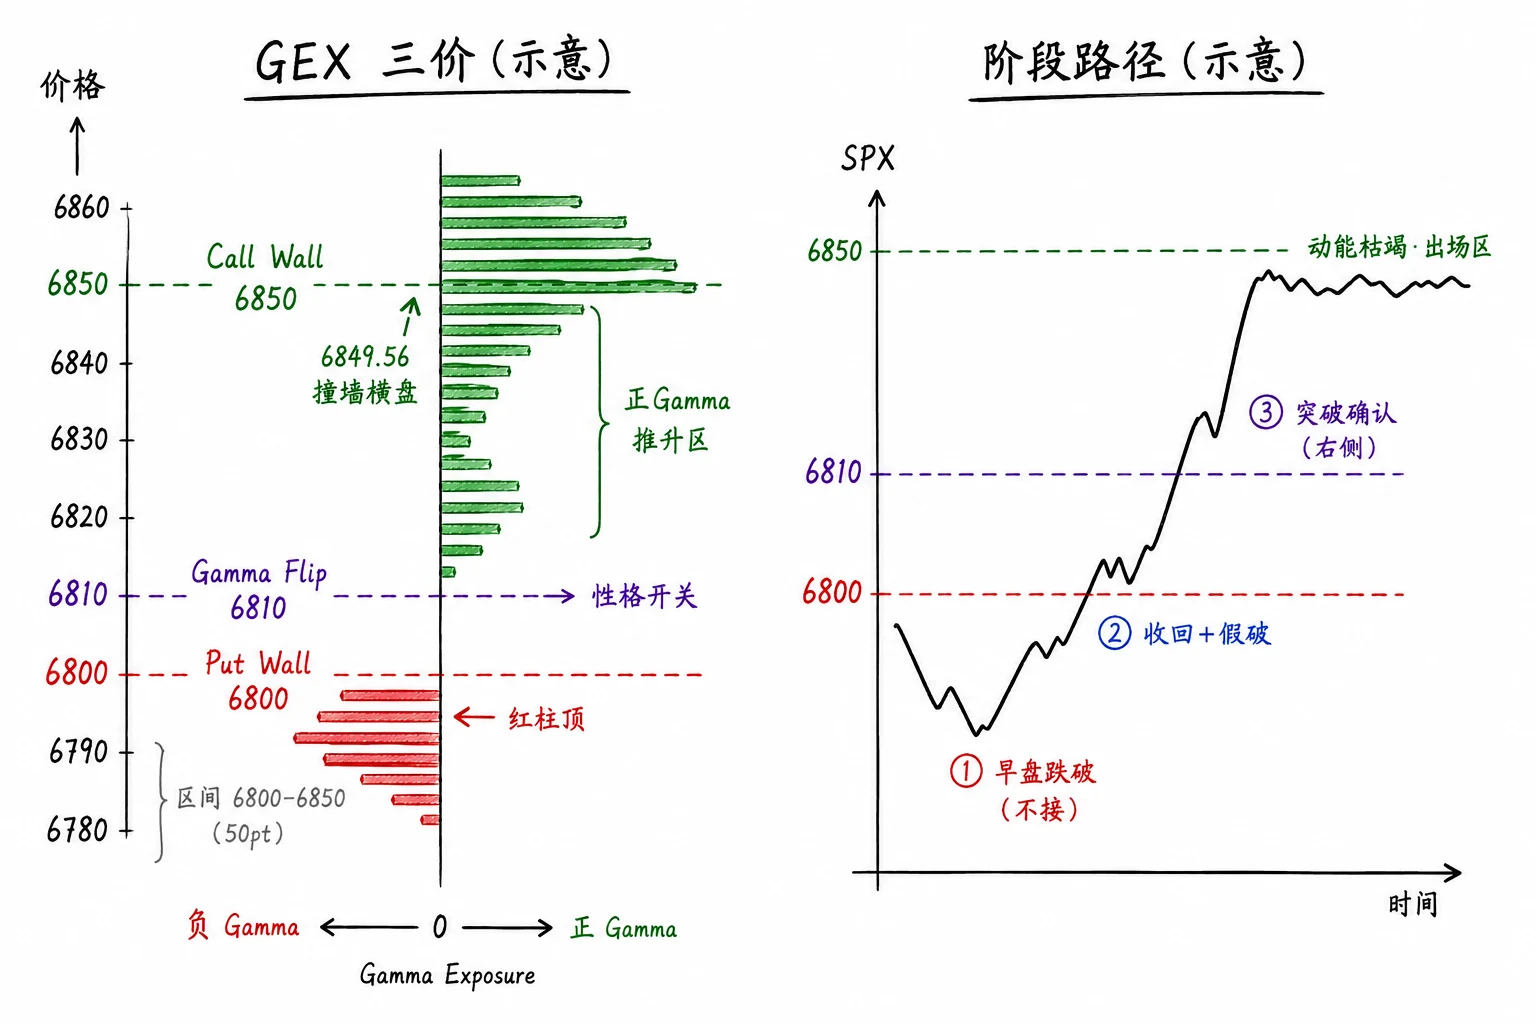
The premarket GEX map marked three key levels:
| Level | Price | Role |
|---|---|---|
| Put Wall | 6800 | Floor below; short-side battle zone |
| Gamma Flip | 6810 | Regime boundary |
| Call Wall | 6850 | Ceiling above; positive-Gamma resistance |
Range: 6800 to 6850, or 50 points.
My plan was to let the market show which part of the range it wanted to inhabit.
Figure 4-3 places the three coordinates on one map.
The Temptation on the Left and Confirmation on the Right
Early selling drove price below the 6800 Put Wall and into deep negative-Gamma territory. Negative Gamma amplifies volatility. Catching the falling knife there felt extremely dangerous; a Gamma squeeze could make the decline accelerate.
The earlier me: price breaks 6800 → chase the short.
The current me: price breaks 6800 → wait for it to return → watch how it returns.
Price regained 6800 and then quickly crossed the 6810 Gamma Flip. Two things happened together. Reclaiming 6800 suggested that the opening move was a false break—a liquidity grab. Holding above 6810 indicated a transition from negative to positive Gamma: the market's character had changed.
A break that immediately withdraws is a false break, like February 13. A move that holds the level and continues higher is a genuine breakout. That distinction gives this chapter its title.
Figure 4-4 shows the entire path from false break to Gamma Flip and Call Wall.
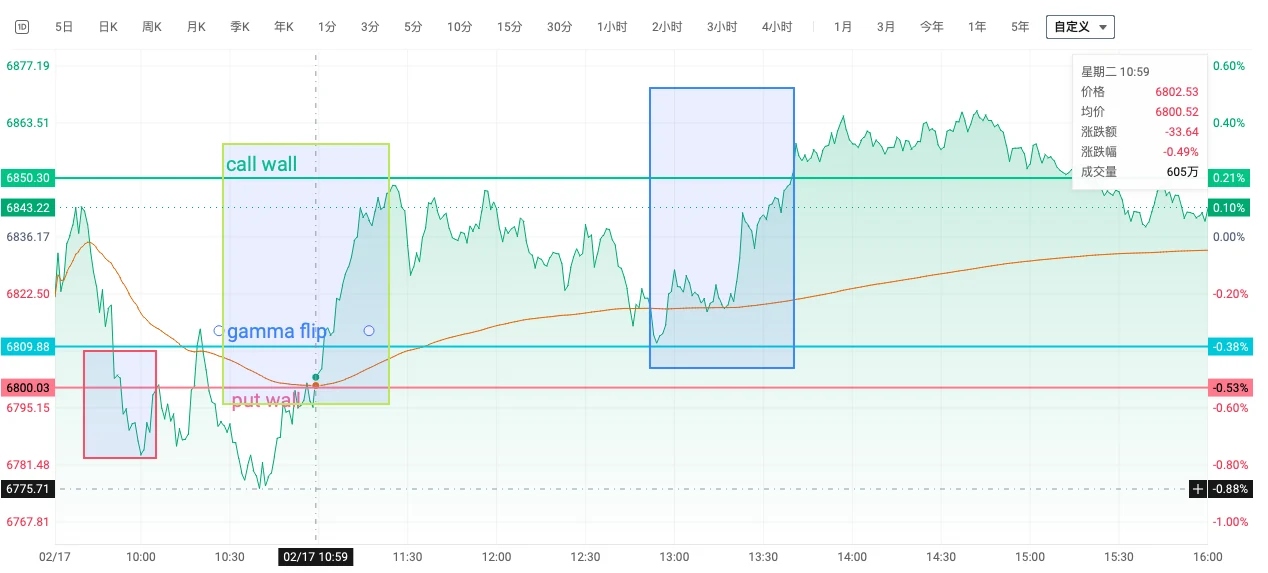
SPX path that day: break below 6800 → reclaim → break above the 6810 Gamma Flip → advance to the 6850 Call Wall.
I treated acceptance above the Gamma Flip as one right-side confirmation signal. It was not a universal answer, only one basis for my judgment. I generally referenced a stop below 6800; every trader must adapt risk to personal tolerance.
Advancing Under Positive-Gamma Damping—and Meeting the Wall
Above the Gamma Flip, when the platform shows positive Gamma under the common assumption that market makers are net long Gamma, hedging is usually sell futures as price rises and buy futures as price falls. That is a counter-trend damping force, not fuel for a rally.
The move from 6810 to 6850 therefore should not be attributed to “positive Gamma pushing price higher.” A more accurate reading is that net buying and trend momentum continued to lift price, while positive-Gamma hedging suppressed volatility, making the advance slower and more prone to pullbacks. I considered the structure relatively clear—but clarity is not a guarantee. It was the combination of reclaimed levels, price action, and regime.
Price reached 6849.56 and began to move sideways, almost exactly at the 6850 Call Wall.
Do not buy a Call at the Call Wall. That was my reminder to myself. Momentum was fading, chasing became harder, and the marginal Gamma payoff to the buyer was declining. I considered exiting nearby, before waiting for the wall itself to be struck.
| Stage | Logic |
|---|---|
| Entry | Technical acceleration + break above Gamma Flip = my trend-confirmation signal at the time |
| Hold | Trend remained intact above Gamma Flip; positive Gamma explained the slower rhythm, not the upward direction |
| Exit | Contact with Call Wall resistance = fading momentum and reason to consider leaving |
These two days were very similar—and entirely different.
Both began with a broken wall: February 13 fell below the Put Wall, and February 17 did too. Yet my response was the same: do nothing at the instant of the break. Let the wall prove whether the move is false or real.
On February 13, price reclaimed the wall, so I recognized a false break. On February 17, price held above the Gamma Flip, so I recognized a genuine breakout. Neither trade came from “guessing the direction correctly.” It came from waiting until the structure spoke before deciding whether to act.
That is harder to learn than any line. Waiting begins with an admission: I do not know what happens next. I can wait until probability tilts toward me and the structure supports the trade, then rely on discipline. Even if I leave 20 points before the Call Wall, I do not fight the hedging pressure at the wall.
Anyone can guess direction. The difficult work lies in two actions that resist instinct: hold your hand when the wall breaks; withdraw before impact. Those two actions made February 13 and February 17 feel so clean.
I traded both days well. Profit was not what made them memorable.
I remember holding my hand twice.
The first time, the Put Wall broke. I neither chased the short nor bought the dip. I waited for price to finish the move and return on its own.
The second time, price climbed toward the Call Wall. I did not wait for “just a little more.” I left before the wall.
Technique did not teach me those actions. They were carved into muscle memory by every earlier time I failed to hold my hand.
Profit gets spent. Charts turn to the next page. But the two memories remain: hold your hand at the break; withdraw before the wall.
In the next chapter, we step away from individual sessions and return to method: how to read the half hour before the open, how to use VWAP, and when GVP represents genuine confluence.